Mycobacterium phage Tortellini
Taxonomy: Viruses; Duplodnaviria; Heunggongvirae; Uroviricota; Caudoviricetes; Caudovirales; Siphoviridae; Tortellinivirus; Mycobacterium virus Tortellini
Average proteome isoelectric point is 5.97
Get precalculated fractions of proteins
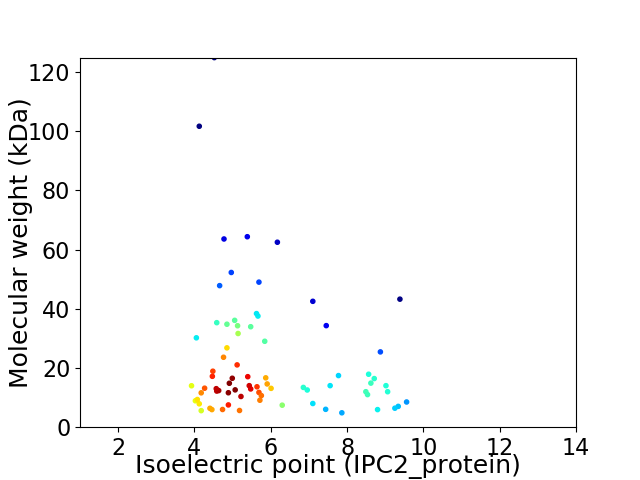
Virtual 2D-PAGE plot for 76 proteins (isoelectric point calculated using IPC2_protein)
Get csv file with sequences according to given criteria:
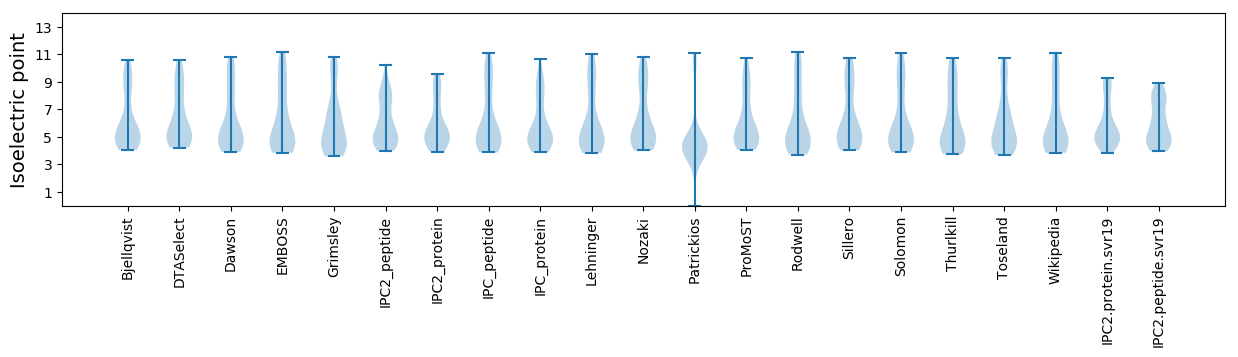
* You can choose from 21 different methods for calculating isoelectric point
Summary statistics related to proteome-wise predictions
Protein with the lowest isoelectric point:
>tr|A0A1D8EX09|A0A1D8EX09_9CAUD Head-to-tail adaptor OS=Mycobacterium phage Tortellini OX=1897497 GN=SEA_TORTELLINI_8 PE=4 SV=1
MM1 pKa = 7.89AYY3 pKa = 10.34AEE5 pKa = 4.98LLDD8 pKa = 3.63TDD10 pKa = 3.86MTTWCPITVHH20 pKa = 6.02YY21 pKa = 10.33KK22 pKa = 9.12VTDD25 pKa = 3.89GDD27 pKa = 3.94QVSYY31 pKa = 10.88LAVTRR36 pKa = 11.84VSFVTATGRR45 pKa = 11.84VEE47 pKa = 5.67AFACDD52 pKa = 3.56EE53 pKa = 4.44TGVATSLAPVWAIDD67 pKa = 3.66GDD69 pKa = 4.14VGHH72 pKa = 6.94NDD74 pKa = 3.21ALVAAGYY81 pKa = 7.62TVII84 pKa = 5.23
MM1 pKa = 7.89AYY3 pKa = 10.34AEE5 pKa = 4.98LLDD8 pKa = 3.63TDD10 pKa = 3.86MTTWCPITVHH20 pKa = 6.02YY21 pKa = 10.33KK22 pKa = 9.12VTDD25 pKa = 3.89GDD27 pKa = 3.94QVSYY31 pKa = 10.88LAVTRR36 pKa = 11.84VSFVTATGRR45 pKa = 11.84VEE47 pKa = 5.67AFACDD52 pKa = 3.56EE53 pKa = 4.44TGVATSLAPVWAIDD67 pKa = 3.66GDD69 pKa = 4.14VGHH72 pKa = 6.94NDD74 pKa = 3.21ALVAAGYY81 pKa = 7.62TVII84 pKa = 5.23
Molecular weight: 8.93 kDa
Isoelectric point according different methods:
Protein with the highest isoelectric point:
>tr|A0A1D8EX60|A0A1D8EX60_9CAUD DNA polymerase III sliding clamp OS=Mycobacterium phage Tortellini OX=1897497 GN=SEA_TORTELLINI_57 PE=4 SV=1
MM1 pKa = 7.31SRR3 pKa = 11.84RR4 pKa = 11.84IIHH7 pKa = 5.43RR8 pKa = 11.84TVHH11 pKa = 5.58KK12 pKa = 9.4RR13 pKa = 11.84TARR16 pKa = 11.84RR17 pKa = 11.84TLALTGLGALAAAGIITATPAEE39 pKa = 4.64ALPGQCGGGPLVGFPTDD56 pKa = 3.95NDD58 pKa = 4.09PATPCC63 pKa = 4.22
MM1 pKa = 7.31SRR3 pKa = 11.84RR4 pKa = 11.84IIHH7 pKa = 5.43RR8 pKa = 11.84TVHH11 pKa = 5.58KK12 pKa = 9.4RR13 pKa = 11.84TARR16 pKa = 11.84RR17 pKa = 11.84TLALTGLGALAAAGIITATPAEE39 pKa = 4.64ALPGQCGGGPLVGFPTDD56 pKa = 3.95NDD58 pKa = 4.09PATPCC63 pKa = 4.22
Molecular weight: 6.42 kDa
Isoelectric point according different methods:
Peptides (in silico digests for buttom-up proteomics)
Below you can find in silico digests of the whole proteome with Trypsin, Chymotrypsin, Trypsin+LysC, LysN, ArgC proteases suitable for different mass spec machines.| Try ESI |
 |
|---|
| ChTry ESI |
|
|---|
| ArgC ESI |
|
|---|
| LysN ESI |
|
|---|
| TryLysC ESI |
|
|---|
| Try MALDI |
|
|---|
| ChTry MALDI |
|
|---|
| ArgC MALDI |
|
|---|
| LysN MALDI |
|
|---|
| TryLysC MALDI |
|
|---|
| Try LTQ |
|
|---|
| ChTry LTQ |
|
|---|
| ArgC LTQ |
|
|---|
| LysN LTQ |
|
|---|
| TryLysC LTQ |
|
|---|
| Try MSlow |
|
|---|
| ChTry MSlow |
|
|---|
| ArgC MSlow |
|
|---|
| LysN MSlow |
|
|---|
| TryLysC MSlow |
|
|---|
| Try MShigh |
|
|---|
| ChTry MShigh |
|
|---|
| ArgC MShigh |
|
|---|
| LysN MShigh |
|
|---|
| TryLysC MShigh |
|
|---|
General Statistics
Number of major isoforms |
Number of additional isoforms |
Number of all proteins |
Number of amino acids |
Min. Seq. Length |
Max. Seq. Length |
Avg. Seq. Length |
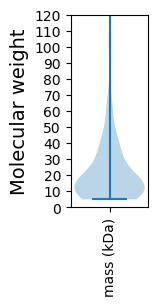
Avg. Mol. Weight |
|---|---|---|---|---|---|---|---|
0 |
15761 |
44 |
1229 |
207.4 |
22.5 |
Amino acid frequency
Ala |
Cys |
Asp |
Glu |
Phe |
Gly |
His |
Ile |
Lys |
Leu |
|---|---|---|---|---|---|---|---|---|---|
12.207 ± 0.54 | 1.041 ± 0.148 |
6.649 ± 0.206 | 6.269 ± 0.328 |
2.919 ± 0.206 | 9.048 ± 0.616 |
1.872 ± 0.184 | 4.549 ± 0.204 |
3.363 ± 0.179 | 7.76 ± 0.24 |
Met |
Asn |
Gln |
Pro |
Arg |
Ser |
Thr |
Val |
Trp |
Tyr |
|---|---|---|---|---|---|---|---|---|---|
1.891 ± 0.099 | 2.823 ± 0.172 |
5.989 ± 0.201 | 3.877 ± 0.286 |
6.935 ± 0.414 | 5.196 ± 0.192 |
6.288 ± 0.249 | 7.011 ± 0.264 |
1.922 ± 0.162 | 2.392 ± 0.152 |
Most of the basic statistics you can see at this page can be downloaded from this CSV file
See this proteome in:

Proteome-pI is available under Creative Commons Attribution-NoDerivs license, for more details see here
| Reference: Kozlowski LP. Proteome-pI 2.0: Proteome Isoelectric Point Database Update. Nucleic Acids Res. 2021, doi: 10.1093/nar/gkab944 | Contact: Lukasz P. Kozlowski |