Romboutsia ilealis
Taxonomy: cellular organisms; Bacteria; Terrabacteria group; Firmicutes; Clostridia; Eubacteriales; Peptostreptococcaceae; Romboutsia
Average proteome isoelectric point is 6.39
Get precalculated fractions of proteins
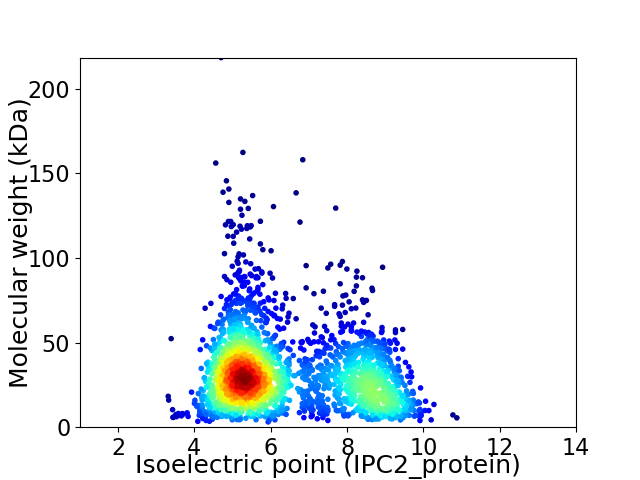
Virtual 2D-PAGE plot for 2333 proteins (isoelectric point calculated using IPC2_protein)
Get csv file with sequences according to given criteria:
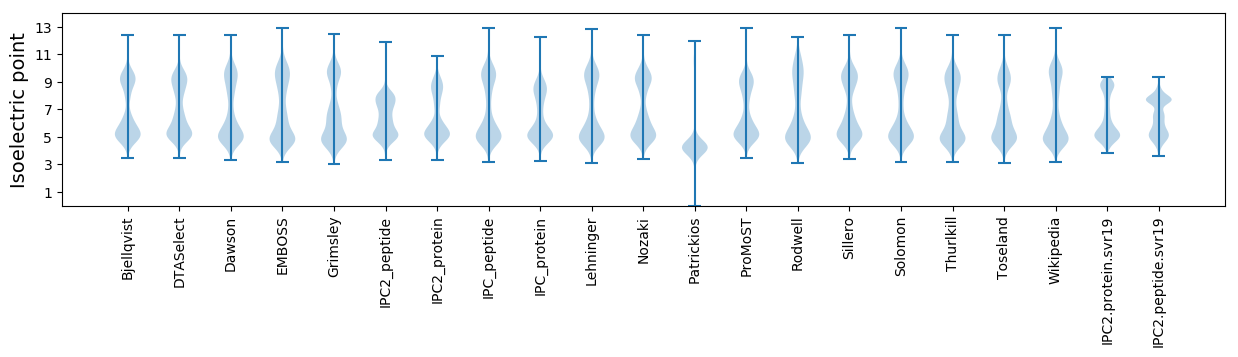
* You can choose from 21 different methods for calculating isoelectric point
Summary statistics related to proteome-wise predictions
Protein with the lowest isoelectric point:
>tr|A0A1V1I171|A0A1V1I171_9FIRM Efflux pump OS=Romboutsia ilealis OX=1115758 GN=CRIB_1361 PE=4 SV=1
MM1 pKa = 7.75DD2 pKa = 3.7QLKK5 pKa = 10.67EE6 pKa = 3.9MFRR9 pKa = 11.84GFDD12 pKa = 3.49FFGDD16 pKa = 3.45NPTLVFLILGLVVLLILGNGDD37 pKa = 3.91LGCFFEE43 pKa = 4.91QNNSLVWIIAIVFILFLFNNNNDD66 pKa = 3.33DD67 pKa = 4.24CYY69 pKa = 11.41CC70 pKa = 4.23
MM1 pKa = 7.75DD2 pKa = 3.7QLKK5 pKa = 10.67EE6 pKa = 3.9MFRR9 pKa = 11.84GFDD12 pKa = 3.49FFGDD16 pKa = 3.45NPTLVFLILGLVVLLILGNGDD37 pKa = 3.91LGCFFEE43 pKa = 4.91QNNSLVWIIAIVFILFLFNNNNDD66 pKa = 3.33DD67 pKa = 4.24CYY69 pKa = 11.41CC70 pKa = 4.23
Molecular weight: 8.04 kDa
Isoelectric point according different methods:
Protein with the highest isoelectric point:
>tr|A0A1V1I456|A0A1V1I456_9FIRM 5-methyltetrahydrofolate--homocysteine methyltransferase OS=Romboutsia ilealis OX=1115758 GN=CRIB_2384 PE=3 SV=1
MM1 pKa = 7.36KK2 pKa = 9.43RR3 pKa = 11.84TYY5 pKa = 9.67QPKK8 pKa = 9.0KK9 pKa = 7.87RR10 pKa = 11.84QRR12 pKa = 11.84KK13 pKa = 8.39KK14 pKa = 8.49EE15 pKa = 3.5HH16 pKa = 6.11GFRR19 pKa = 11.84KK20 pKa = 9.77RR21 pKa = 11.84MKK23 pKa = 9.11TSNGRR28 pKa = 11.84NVLKK32 pKa = 10.51RR33 pKa = 11.84RR34 pKa = 11.84RR35 pKa = 11.84AKK37 pKa = 9.9GRR39 pKa = 11.84NRR41 pKa = 11.84LTHH44 pKa = 6.18
MM1 pKa = 7.36KK2 pKa = 9.43RR3 pKa = 11.84TYY5 pKa = 9.67QPKK8 pKa = 9.0KK9 pKa = 7.87RR10 pKa = 11.84QRR12 pKa = 11.84KK13 pKa = 8.39KK14 pKa = 8.49EE15 pKa = 3.5HH16 pKa = 6.11GFRR19 pKa = 11.84KK20 pKa = 9.77RR21 pKa = 11.84MKK23 pKa = 9.11TSNGRR28 pKa = 11.84NVLKK32 pKa = 10.51RR33 pKa = 11.84RR34 pKa = 11.84RR35 pKa = 11.84AKK37 pKa = 9.9GRR39 pKa = 11.84NRR41 pKa = 11.84LTHH44 pKa = 6.18
Molecular weight: 5.52 kDa
Isoelectric point according different methods:
Peptides (in silico digests for buttom-up proteomics)
Below you can find in silico digests of the whole proteome with Trypsin, Chymotrypsin, Trypsin+LysC, LysN, ArgC proteases suitable for different mass spec machines.| Try ESI |
 |
|---|
| ChTry ESI |
|
|---|
| ArgC ESI |
|
|---|
| LysN ESI |
|
|---|
| TryLysC ESI |
|
|---|
| Try MALDI |
|
|---|
| ChTry MALDI |
|
|---|
| ArgC MALDI |
|
|---|
| LysN MALDI |
|
|---|
| TryLysC MALDI |
|
|---|
| Try LTQ |
|
|---|
| ChTry LTQ |
|
|---|
| ArgC LTQ |
|
|---|
| LysN LTQ |
|
|---|
| TryLysC LTQ |
|
|---|
| Try MSlow |
|
|---|
| ChTry MSlow |
|
|---|
| ArgC MSlow |
|
|---|
| LysN MSlow |
|
|---|
| TryLysC MSlow |
|
|---|
| Try MShigh |
|
|---|
| ChTry MShigh |
|
|---|
| ArgC MShigh |
|
|---|
| LysN MShigh |
|
|---|
| TryLysC MShigh |
|
|---|
General Statistics
Number of major isoforms |
Number of additional isoforms |
Number of all proteins |
Number of amino acids |
Min. Seq. Length |
Max. Seq. Length |
Avg. Seq. Length |
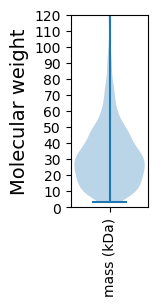
Avg. Mol. Weight |
|---|---|---|---|---|---|---|---|
0 |
698914 |
29 |
1924 |
299.6 |
33.9 |
Amino acid frequency
Ala |
Cys |
Asp |
Glu |
Phe |
Gly |
His |
Ile |
Lys |
Leu |
|---|---|---|---|---|---|---|---|---|---|
5.199 ± 0.063 | 1.175 ± 0.022 |
5.954 ± 0.046 | 7.406 ± 0.06 |
4.127 ± 0.035 | 6.073 ± 0.053 |
1.354 ± 0.02 | 10.419 ± 0.073 |
9.166 ± 0.061 | 9.021 ± 0.056 |
Met |
Asn |
Gln |
Pro |
Arg |
Ser |
Thr |
Val |
Trp |
Tyr |
|---|---|---|---|---|---|---|---|---|---|
2.626 ± 0.025 | 6.877 ± 0.058 |
2.637 ± 0.026 | 2.334 ± 0.023 |
3.143 ± 0.036 | 6.265 ± 0.049 |
4.92 ± 0.037 | 6.435 ± 0.041 |
0.572 ± 0.013 | 4.296 ± 0.039 |
Most of the basic statistics you can see at this page can be downloaded from this CSV file
See this proteome in:

Proteome-pI is available under Creative Commons Attribution-NoDerivs license, for more details see here
| Reference: Kozlowski LP. Proteome-pI 2.0: Proteome Isoelectric Point Database Update. Nucleic Acids Res. 2021, doi: 10.1093/nar/gkab944 | Contact: Lukasz P. Kozlowski |