Lactococcus phage CHPC964
Taxonomy: Viruses; Duplodnaviria; Heunggongvirae; Uroviricota; Caudoviricetes; Caudovirales; Siphoviridae; Skunavirus; Lactococcus virus CHPC964
Average proteome isoelectric point is 6.61
Get precalculated fractions of proteins
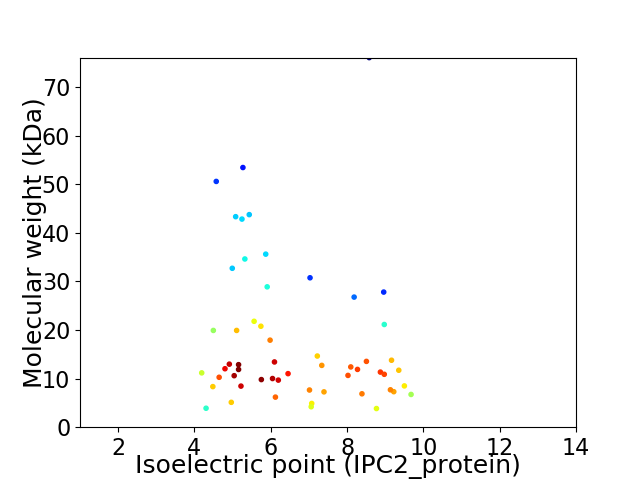
Virtual 2D-PAGE plot for 56 proteins (isoelectric point calculated using IPC2_protein)
Get csv file with sequences according to given criteria:
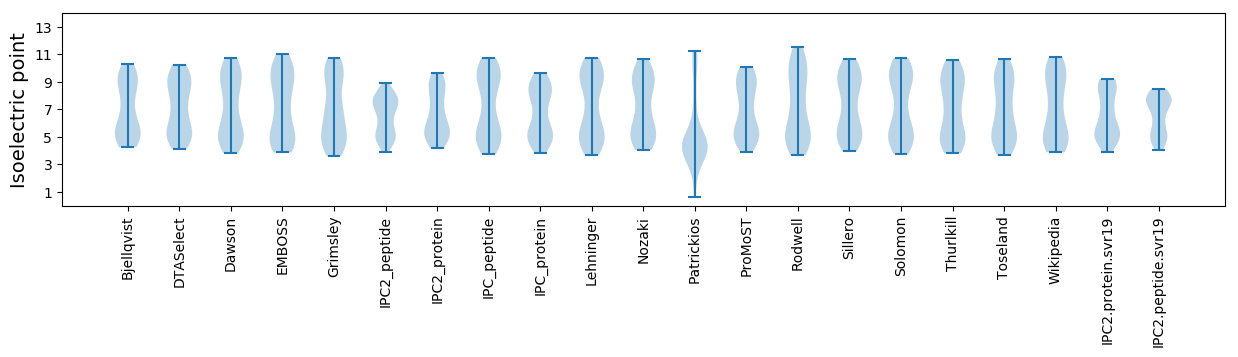
* You can choose from 21 different methods for calculating isoelectric point
Summary statistics related to proteome-wise predictions
Protein with the lowest isoelectric point:
>tr|A0A650EW59|A0A650EW59_9CAUD Uncharacterized protein OS=Lactococcus phage CHPC964 OX=2675256 GN=CHPC964_000966 PE=4 SV=1
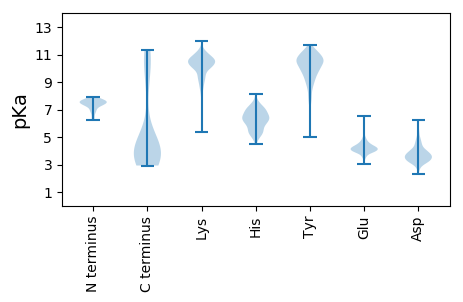
MM1 pKa = 7.62IDD3 pKa = 3.38VVGWFAIGVVVGMAVSCVFCMFLVWLFTKK32 pKa = 10.57DD33 pKa = 3.23SEE35 pKa = 4.51
MM1 pKa = 7.62IDD3 pKa = 3.38VVGWFAIGVVVGMAVSCVFCMFLVWLFTKK32 pKa = 10.57DD33 pKa = 3.23SEE35 pKa = 4.51
Molecular weight: 3.9 kDa
Isoelectric point according different methods:
Protein with the highest isoelectric point:
>tr|A0A650F879|A0A650F879_9CAUD Tail length tape-measure protein OS=Lactococcus phage CHPC964 OX=2675256 GN=CHPC964_000997 PE=4 SV=1
MM1 pKa = 7.46CKK3 pKa = 9.75KK4 pKa = 10.38RR5 pKa = 11.84KK6 pKa = 5.78YY7 pKa = 8.56TKK9 pKa = 9.78MGALYY14 pKa = 10.54SIANAQHH21 pKa = 5.94NKK23 pKa = 9.45KK24 pKa = 10.07KK25 pKa = 10.41ADD27 pKa = 4.21KK28 pKa = 10.12IPVRR32 pKa = 11.84AYY34 pKa = 8.85YY35 pKa = 10.06CKK37 pKa = 9.74WCNSYY42 pKa = 10.56HH43 pKa = 7.02LSSQQRR49 pKa = 11.84LNIKK53 pKa = 9.21TGVIGG58 pKa = 3.97
MM1 pKa = 7.46CKK3 pKa = 9.75KK4 pKa = 10.38RR5 pKa = 11.84KK6 pKa = 5.78YY7 pKa = 8.56TKK9 pKa = 9.78MGALYY14 pKa = 10.54SIANAQHH21 pKa = 5.94NKK23 pKa = 9.45KK24 pKa = 10.07KK25 pKa = 10.41ADD27 pKa = 4.21KK28 pKa = 10.12IPVRR32 pKa = 11.84AYY34 pKa = 8.85YY35 pKa = 10.06CKK37 pKa = 9.74WCNSYY42 pKa = 10.56HH43 pKa = 7.02LSSQQRR49 pKa = 11.84LNIKK53 pKa = 9.21TGVIGG58 pKa = 3.97
Molecular weight: 6.74 kDa
Isoelectric point according different methods:
Peptides (in silico digests for buttom-up proteomics)
Below you can find in silico digests of the whole proteome with Trypsin, Chymotrypsin, Trypsin+LysC, LysN, ArgC proteases suitable for different mass spec machines.| Try ESI |
 |
|---|
| ChTry ESI |
|
|---|
| ArgC ESI |
|
|---|
| LysN ESI |
|
|---|
| TryLysC ESI |
|
|---|
| Try MALDI |
|
|---|
| ChTry MALDI |
|
|---|
| ArgC MALDI |
|
|---|
| LysN MALDI |
|
|---|
| TryLysC MALDI |
|
|---|
| Try LTQ |
|
|---|
| ChTry LTQ |
|
|---|
| ArgC LTQ |
|
|---|
| LysN LTQ |
|
|---|
| TryLysC LTQ |
|
|---|
| Try MSlow |
|
|---|
| ChTry MSlow |
|
|---|
| ArgC MSlow |
|
|---|
| LysN MSlow |
|
|---|
| TryLysC MSlow |
|
|---|
| Try MShigh |
|
|---|
| ChTry MShigh |
|
|---|
| ArgC MShigh |
|
|---|
| LysN MShigh |
|
|---|
| TryLysC MShigh |
|
|---|
General Statistics
Number of major isoforms |
Number of additional isoforms |
Number of all proteins |
Number of amino acids |
Min. Seq. Length |
Max. Seq. Length |
Avg. Seq. Length |
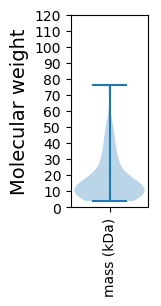
Avg. Mol. Weight |
|---|---|---|---|---|---|---|---|
0 |
8866 |
35 |
725 |
158.3 |
17.94 |
Amino acid frequency
Ala |
Cys |
Asp |
Glu |
Phe |
Gly |
His |
Ile |
Lys |
Leu |
|---|---|---|---|---|---|---|---|---|---|
6.271 ± 0.482 | 0.722 ± 0.188 |
5.335 ± 0.279 | 7.275 ± 0.645 |
4.388 ± 0.391 | 6.125 ± 0.614 |
1.218 ± 0.154 | 7.207 ± 0.301 |
8.877 ± 0.579 | 8.651 ± 0.422 |
Met |
Asn |
Gln |
Pro |
Arg |
Ser |
Thr |
Val |
Trp |
Tyr |
|---|---|---|---|---|---|---|---|---|---|
2.402 ± 0.173 | 6.982 ± 0.376 |
2.301 ± 0.245 | 3.643 ± 0.26 |
3.35 ± 0.236 | 6.553 ± 0.432 |
6.542 ± 0.373 | 6.643 ± 0.396 |
1.511 ± 0.185 | 4.004 ± 0.367 |
Most of the basic statistics you can see at this page can be downloaded from this CSV file
See this proteome in:

Proteome-pI is available under Creative Commons Attribution-NoDerivs license, for more details see here
| Reference: Kozlowski LP. Proteome-pI 2.0: Proteome Isoelectric Point Database Update. Nucleic Acids Res. 2021, doi: 10.1093/nar/gkab944 | Contact: Lukasz P. Kozlowski |