Foxtail mosaic virus
Taxonomy: Viruses; Riboviria; Orthornavirae; Kitrinoviricota; Alsuviricetes; Tymovirales; Alphaflexiviridae; Potexvirus
Average proteome isoelectric point is 7.36
Get precalculated fractions of proteins

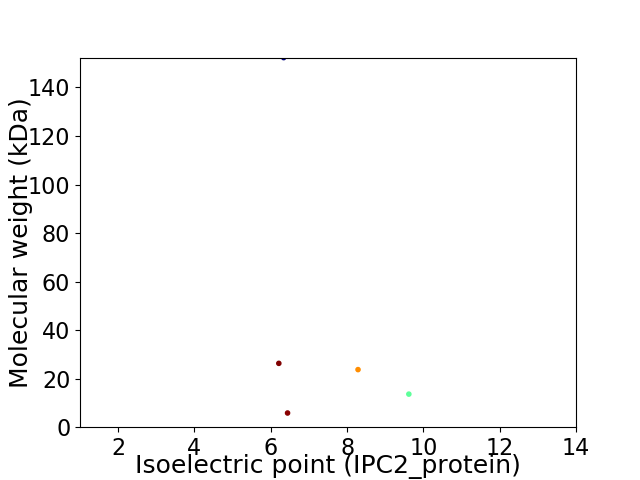
Virtual 2D-PAGE plot for 5 proteins (isoelectric point calculated using IPC2_protein)
Get csv file with sequences according to given criteria:
* You can choose from 21 different methods for calculating isoelectric point
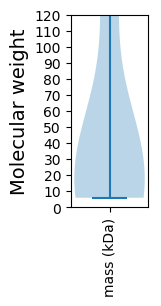
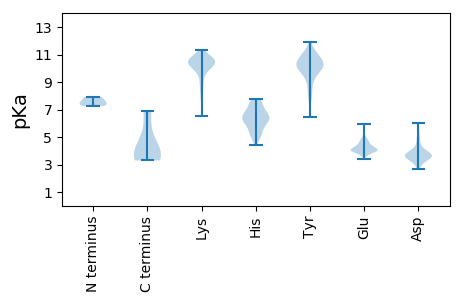
Summary statistics related to proteome-wise predictions


Protein with the lowest isoelectric point:
>sp|P22170|TGB2_FXMV Movement protein TGB2 OS=Foxtail mosaic virus OX=12179 GN=ORF3 PE=3 SV=2
MM1 pKa = 7.94DD2 pKa = 3.99SEE4 pKa = 4.23IVEE7 pKa = 4.47RR8 pKa = 11.84LTKK11 pKa = 10.6LGFVKK16 pKa = 10.17TSHH19 pKa = 4.75THH21 pKa = 5.21IAGEE25 pKa = 4.05PLVIHH30 pKa = 6.67AVAGAGKK37 pKa = 6.67TTLLRR42 pKa = 11.84SLLEE46 pKa = 4.02LPGVEE51 pKa = 4.05VFTGGEE57 pKa = 4.01HH58 pKa = 7.71DD59 pKa = 4.47PPNLSGKK66 pKa = 8.9YY67 pKa = 8.66IRR69 pKa = 11.84CAAPPVAGAYY79 pKa = 9.96NILDD83 pKa = 4.33EE84 pKa = 4.54YY85 pKa = 10.05PAYY88 pKa = 9.71PNWRR92 pKa = 11.84SQPWNVLIADD102 pKa = 3.73NLQYY106 pKa = 10.88KK107 pKa = 9.96EE108 pKa = 3.95PTARR112 pKa = 11.84AHH114 pKa = 4.45YY115 pKa = 7.92TCNRR119 pKa = 11.84THH121 pKa = 7.7RR122 pKa = 11.84LGQLTVDD129 pKa = 3.71ALRR132 pKa = 11.84RR133 pKa = 11.84VGFDD137 pKa = 2.64ITFAGTQTEE146 pKa = 4.62DD147 pKa = 3.23YY148 pKa = 10.45GFQEE152 pKa = 3.9GHH154 pKa = 7.4LYY156 pKa = 10.07TSQFYY161 pKa = 10.45GQVISLDD168 pKa = 3.86TQAHH172 pKa = 6.59KK173 pKa = 10.48IAVRR177 pKa = 11.84HH178 pKa = 5.26GLAPLSALEE187 pKa = 4.08TRR189 pKa = 11.84GLEE192 pKa = 4.01FDD194 pKa = 3.68EE195 pKa = 4.65TTVITTKK202 pKa = 10.58TSLEE206 pKa = 4.17EE207 pKa = 3.85VKK209 pKa = 10.31DD210 pKa = 3.43RR211 pKa = 11.84HH212 pKa = 4.97MVYY215 pKa = 10.4VALTRR220 pKa = 11.84HH221 pKa = 5.99RR222 pKa = 11.84RR223 pKa = 11.84TCHH226 pKa = 6.85LYY228 pKa = 8.32TAHH231 pKa = 7.14FAPSAA236 pKa = 3.52
MM1 pKa = 7.94DD2 pKa = 3.99SEE4 pKa = 4.23IVEE7 pKa = 4.47RR8 pKa = 11.84LTKK11 pKa = 10.6LGFVKK16 pKa = 10.17TSHH19 pKa = 4.75THH21 pKa = 5.21IAGEE25 pKa = 4.05PLVIHH30 pKa = 6.67AVAGAGKK37 pKa = 6.67TTLLRR42 pKa = 11.84SLLEE46 pKa = 4.02LPGVEE51 pKa = 4.05VFTGGEE57 pKa = 4.01HH58 pKa = 7.71DD59 pKa = 4.47PPNLSGKK66 pKa = 8.9YY67 pKa = 8.66IRR69 pKa = 11.84CAAPPVAGAYY79 pKa = 9.96NILDD83 pKa = 4.33EE84 pKa = 4.54YY85 pKa = 10.05PAYY88 pKa = 9.71PNWRR92 pKa = 11.84SQPWNVLIADD102 pKa = 3.73NLQYY106 pKa = 10.88KK107 pKa = 9.96EE108 pKa = 3.95PTARR112 pKa = 11.84AHH114 pKa = 4.45YY115 pKa = 7.92TCNRR119 pKa = 11.84THH121 pKa = 7.7RR122 pKa = 11.84LGQLTVDD129 pKa = 3.71ALRR132 pKa = 11.84RR133 pKa = 11.84VGFDD137 pKa = 2.64ITFAGTQTEE146 pKa = 4.62DD147 pKa = 3.23YY148 pKa = 10.45GFQEE152 pKa = 3.9GHH154 pKa = 7.4LYY156 pKa = 10.07TSQFYY161 pKa = 10.45GQVISLDD168 pKa = 3.86TQAHH172 pKa = 6.59KK173 pKa = 10.48IAVRR177 pKa = 11.84HH178 pKa = 5.26GLAPLSALEE187 pKa = 4.08TRR189 pKa = 11.84GLEE192 pKa = 4.01FDD194 pKa = 3.68EE195 pKa = 4.65TTVITTKK202 pKa = 10.58TSLEE206 pKa = 4.17EE207 pKa = 3.85VKK209 pKa = 10.31DD210 pKa = 3.43RR211 pKa = 11.84HH212 pKa = 4.97MVYY215 pKa = 10.4VALTRR220 pKa = 11.84HH221 pKa = 5.99RR222 pKa = 11.84RR223 pKa = 11.84TCHH226 pKa = 6.85LYY228 pKa = 8.32TAHH231 pKa = 7.14FAPSAA236 pKa = 3.52
Molecular weight: 26.31 kDa
Isoelectric point according different methods:
Protein with the highest isoelectric point:
>sp|P22171|TGB3_FXMV Movement protein TGBp3 OS=Foxtail mosaic virus OX=12179 GN=ORF4 PE=3 SV=2
MM1 pKa = 7.26SLSHH5 pKa = 6.11GTGAPAISTPLTLRR19 pKa = 11.84PPPDD23 pKa = 3.26NTKK26 pKa = 10.8AILTIAIGIAASLVFFMLTRR46 pKa = 11.84NNLPHH51 pKa = 7.55VGDD54 pKa = 4.91NIHH57 pKa = 6.41SLPHH61 pKa = 5.78GGSYY65 pKa = 10.05IDD67 pKa = 3.58GTKK70 pKa = 10.3SINYY74 pKa = 8.21RR75 pKa = 11.84PPASRR80 pKa = 11.84YY81 pKa = 8.64PSSNLLAFAPPILAAVLFFLTQPYY105 pKa = 10.08LATRR109 pKa = 11.84RR110 pKa = 11.84SRR112 pKa = 11.84CVRR115 pKa = 11.84CFVVHH120 pKa = 6.42GACTNHH126 pKa = 5.36TT127 pKa = 3.9
MM1 pKa = 7.26SLSHH5 pKa = 6.11GTGAPAISTPLTLRR19 pKa = 11.84PPPDD23 pKa = 3.26NTKK26 pKa = 10.8AILTIAIGIAASLVFFMLTRR46 pKa = 11.84NNLPHH51 pKa = 7.55VGDD54 pKa = 4.91NIHH57 pKa = 6.41SLPHH61 pKa = 5.78GGSYY65 pKa = 10.05IDD67 pKa = 3.58GTKK70 pKa = 10.3SINYY74 pKa = 8.21RR75 pKa = 11.84PPASRR80 pKa = 11.84YY81 pKa = 8.64PSSNLLAFAPPILAAVLFFLTQPYY105 pKa = 10.08LATRR109 pKa = 11.84RR110 pKa = 11.84SRR112 pKa = 11.84CVRR115 pKa = 11.84CFVVHH120 pKa = 6.42GACTNHH126 pKa = 5.36TT127 pKa = 3.9
Molecular weight: 13.64 kDa
Isoelectric point according different methods:
Peptides (in silico digests for buttom-up proteomics)
Below you can find in silico digests of the whole proteome with Trypsin, Chymotrypsin, Trypsin+LysC, LysN, ArgC proteases suitable for different mass spec machines.| Try ESI |
 |
|---|
| ChTry ESI |
 |
|---|
| ArgC ESI |
 |
|---|
| LysN ESI |
 |
|---|
| TryLysC ESI |
 |
|---|
| Try MALDI |
 |
|---|
| ChTry MALDI |
 |
|---|
| ArgC MALDI |
 |
|---|
| LysN MALDI |
 |
|---|
| TryLysC MALDI |
 |
|---|
| Try LTQ |
 |
|---|
| ChTry LTQ |
 |
|---|
| ArgC LTQ |
 |
|---|
| LysN LTQ |
 |
|---|
| TryLysC LTQ |
 |
|---|
| Try MSlow |
 |
|---|
| ChTry MSlow |
 |
|---|
| ArgC MSlow |
 |
|---|
| LysN MSlow |
 |
|---|
| TryLysC MSlow |
 |
|---|
| Try MShigh |
 |
|---|
| ChTry MShigh |
 |
|---|
| ArgC MShigh |
 |
|---|
| LysN MShigh |
 |
|---|
| TryLysC MShigh |
 |
|---|
General Statistics
Number of major isoforms |
Number of additional isoforms |
Number of all proteins |
Number of amino acids |
Min. Seq. Length |
Max. Seq. Length |
Avg. Seq. Length |
Avg. Mol. Weight |
|---|---|---|---|---|---|---|---|
0 |
1965 |
52 |
1335 |
393.0 |
44.37 |
Amino acid frequency
Ala |
Cys |
Asp |
Glu |
Phe |
Gly |
His |
Ile |
Lys |
Leu |
|---|---|---|---|---|---|---|---|---|---|
8.601 ± 1.281 | 1.425 ± 0.337 |
5.038 ± 0.632 | 6.056 ± 1.187 |
4.173 ± 0.389 | 4.682 ± 0.657 |
3.155 ± 0.923 | 4.885 ± 0.365 |
5.7 ± 1.082 | 9.618 ± 0.715 |
Met |
Asn |
Gln |
Pro |
Arg |
Ser |
Thr |
Val |
Trp |
Tyr |
|---|---|---|---|---|---|---|---|---|---|
1.985 ± 0.415 | 4.224 ± 0.639 |
7.125 ± 0.615 | 4.071 ± 0.467 |
5.598 ± 0.214 | 5.191 ± 0.545 |
7.837 ± 0.623 | 5.598 ± 0.442 |
1.221 ± 0.257 | 3.817 ± 0.312 |
Most of the basic statistics you can see at this page can be downloaded from this CSV file
Proteome-pI is available under Creative Commons Attribution-NoDerivs license, for more details see here
| Reference: Kozlowski LP. Proteome-pI 2.0: Proteome Isoelectric Point Database Update. Nucleic Acids Res. 2021, doi: 10.1093/nar/gkab944 | Contact: Lukasz P. Kozlowski |
