Bacillus sp. FJAT-26390
Taxonomy: cellular organisms; Bacteria; Terrabacteria group; Firmicutes; Bacilli; Bacillales; Bacillaceae; Bacillus; unclassified Bacillus (in: Bacteria)
Average proteome isoelectric point is 6.31
Get precalculated fractions of proteins
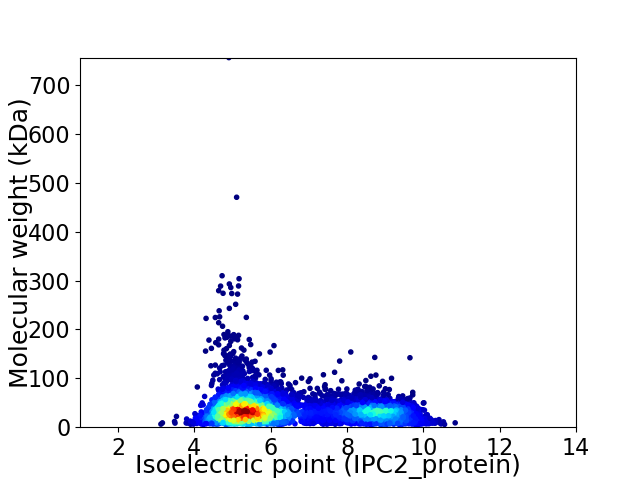
Virtual 2D-PAGE plot for 6340 proteins (isoelectric point calculated using IPC2_protein)
Get csv file with sequences according to given criteria:
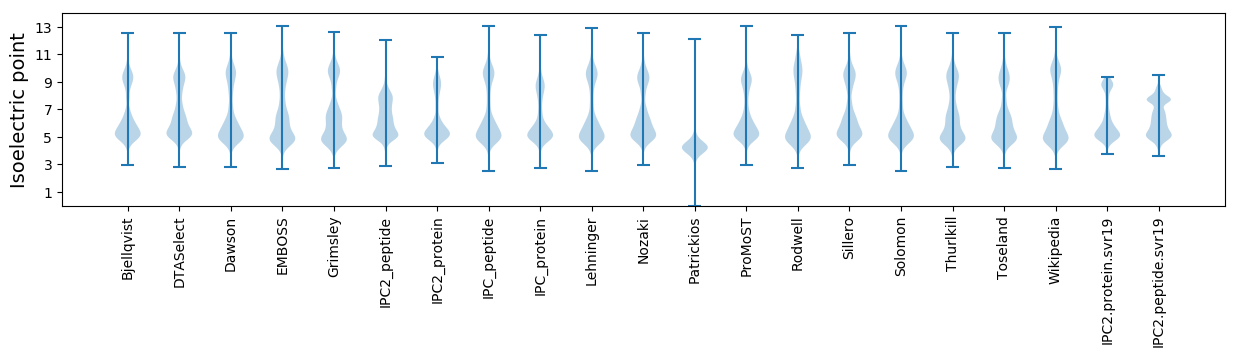
* You can choose from 21 different methods for calculating isoelectric point
Summary statistics related to proteome-wise predictions
Protein with the lowest isoelectric point:
>tr|A0A1B8VXQ4|A0A1B8VXQ4_9BACI Uncharacterized protein OS=Bacillus sp. FJAT-26390 OX=1743142 GN=A7975_23905 PE=4 SV=1
MM1 pKa = 8.06PITKK5 pKa = 9.59PFMAARR11 pKa = 11.84RR12 pKa = 11.84FSATAADD19 pKa = 4.09GTGVGAAYY27 pKa = 10.53NILATATTNDD37 pKa = 3.39AGVAPTAFPTAPAYY51 pKa = 10.38YY52 pKa = 9.93NLYY55 pKa = 10.29INAQIQTADD64 pKa = 3.5TSSVTTTAITIPDD77 pKa = 4.51GDD79 pKa = 4.36TLDD82 pKa = 4.09PATPIVIEE90 pKa = 4.2FVVNN94 pKa = 3.98
MM1 pKa = 8.06PITKK5 pKa = 9.59PFMAARR11 pKa = 11.84RR12 pKa = 11.84FSATAADD19 pKa = 4.09GTGVGAAYY27 pKa = 10.53NILATATTNDD37 pKa = 3.39AGVAPTAFPTAPAYY51 pKa = 10.38YY52 pKa = 9.93NLYY55 pKa = 10.29INAQIQTADD64 pKa = 3.5TSSVTTTAITIPDD77 pKa = 4.51GDD79 pKa = 4.36TLDD82 pKa = 4.09PATPIVIEE90 pKa = 4.2FVVNN94 pKa = 3.98
Molecular weight: 9.67 kDa
Isoelectric point according different methods:
Protein with the highest isoelectric point:
>tr|A0A1B8W851|A0A1B8W851_9BACI Uncharacterized protein OS=Bacillus sp. FJAT-26390 OX=1743142 GN=A7975_17580 PE=4 SV=1
MM1 pKa = 7.54LARR4 pKa = 11.84VGGFDD9 pKa = 5.38GIMSMMGKK17 pKa = 8.81VQQFFGIFQQIRR29 pKa = 11.84PAFKK33 pKa = 9.83MVGSLFGTKK42 pKa = 10.17AFLSGVPSSRR52 pKa = 11.84VRR54 pKa = 11.84SKK56 pKa = 11.22NKK58 pKa = 9.35KK59 pKa = 9.35AKK61 pKa = 10.05LNSRR65 pKa = 11.84AAAASRR71 pKa = 11.84QKK73 pKa = 9.78TSRR76 pKa = 11.84KK77 pKa = 9.07RR78 pKa = 11.84SSRR81 pKa = 3.4
MM1 pKa = 7.54LARR4 pKa = 11.84VGGFDD9 pKa = 5.38GIMSMMGKK17 pKa = 8.81VQQFFGIFQQIRR29 pKa = 11.84PAFKK33 pKa = 9.83MVGSLFGTKK42 pKa = 10.17AFLSGVPSSRR52 pKa = 11.84VRR54 pKa = 11.84SKK56 pKa = 11.22NKK58 pKa = 9.35KK59 pKa = 9.35AKK61 pKa = 10.05LNSRR65 pKa = 11.84AAAASRR71 pKa = 11.84QKK73 pKa = 9.78TSRR76 pKa = 11.84KK77 pKa = 9.07RR78 pKa = 11.84SSRR81 pKa = 3.4
Molecular weight: 8.91 kDa
Isoelectric point according different methods:
Peptides (in silico digests for buttom-up proteomics)
Below you can find in silico digests of the whole proteome with Trypsin, Chymotrypsin, Trypsin+LysC, LysN, ArgC proteases suitable for different mass spec machines.| Try ESI |
 |
|---|
| ChTry ESI |
|
|---|
| ArgC ESI |
|
|---|
| LysN ESI |
|
|---|
| TryLysC ESI |
|
|---|
| Try MALDI |
|
|---|
| ChTry MALDI |
|
|---|
| ArgC MALDI |
|
|---|
| LysN MALDI |
|
|---|
| TryLysC MALDI |
|
|---|
| Try LTQ |
|
|---|
| ChTry LTQ |
|
|---|
| ArgC LTQ |
|
|---|
| LysN LTQ |
|
|---|
| TryLysC LTQ |
|
|---|
| Try MSlow |
|
|---|
| ChTry MSlow |
|
|---|
| ArgC MSlow |
|
|---|
| LysN MSlow |
|
|---|
| TryLysC MSlow |
|
|---|
| Try MShigh |
|
|---|
| ChTry MShigh |
|
|---|
| ArgC MShigh |
|
|---|
| LysN MShigh |
|
|---|
| TryLysC MShigh |
|
|---|
General Statistics
Number of major isoforms |
Number of additional isoforms |
Number of all proteins |
Number of amino acids |
Min. Seq. Length |
Max. Seq. Length |
Avg. Seq. Length |
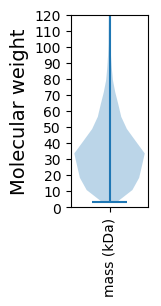
Avg. Mol. Weight |
|---|---|---|---|---|---|---|---|
0 |
2129051 |
26 |
6751 |
335.8 |
37.35 |
Amino acid frequency
Ala |
Cys |
Asp |
Glu |
Phe |
Gly |
His |
Ile |
Lys |
Leu |
|---|---|---|---|---|---|---|---|---|---|
8.631 ± 0.037 | 0.675 ± 0.008 |
5.148 ± 0.021 | 6.594 ± 0.036 |
4.232 ± 0.023 | 7.278 ± 0.034 |
2.058 ± 0.016 | 6.914 ± 0.029 |
5.554 ± 0.031 | 10.051 ± 0.04 |
Met |
Asn |
Gln |
Pro |
Arg |
Ser |
Thr |
Val |
Trp |
Tyr |
|---|---|---|---|---|---|---|---|---|---|
2.783 ± 0.017 | 3.995 ± 0.025 |
3.903 ± 0.02 | 3.866 ± 0.02 |
4.663 ± 0.028 | 6.534 ± 0.024 |
5.409 ± 0.031 | 6.918 ± 0.024 |
1.32 ± 0.014 | 3.472 ± 0.019 |
Most of the basic statistics you can see at this page can be downloaded from this CSV file
See this proteome in:

Proteome-pI is available under Creative Commons Attribution-NoDerivs license, for more details see here
| Reference: Kozlowski LP. Proteome-pI 2.0: Proteome Isoelectric Point Database Update. Nucleic Acids Res. 2021, doi: 10.1093/nar/gkab944 | Contact: Lukasz P. Kozlowski |