bacterium YEK0313
Taxonomy: cellular organisms; Bacteria; unclassified Bacteria
Average proteome isoelectric point is 7.02
Get precalculated fractions of proteins
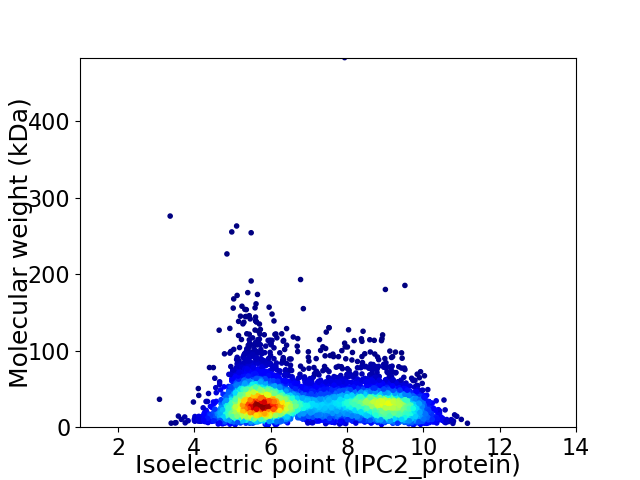
Virtual 2D-PAGE plot for 6563 proteins (isoelectric point calculated using IPC2_protein)
Get csv file with sequences according to given criteria:
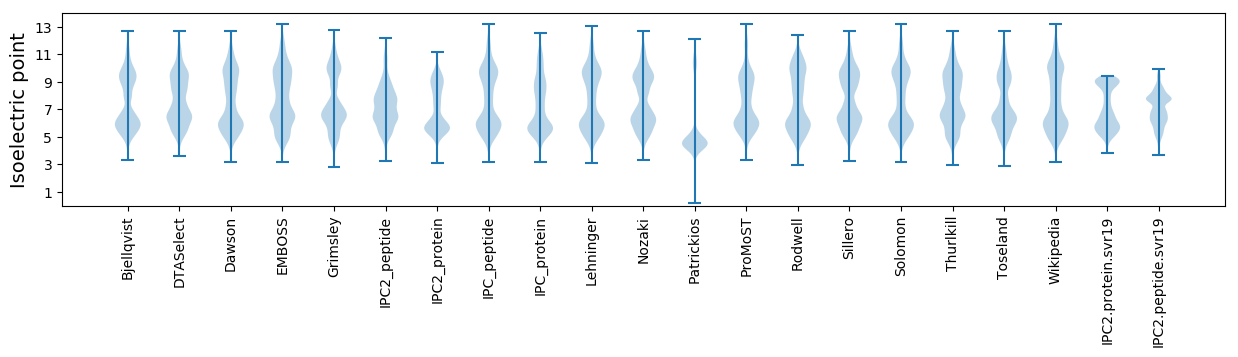
* You can choose from 21 different methods for calculating isoelectric point
Summary statistics related to proteome-wise predictions
Protein with the lowest isoelectric point:
>tr|A0A0A1PQ12|A0A0A1PQ12_9BACT 3-isopropylmalate dehydrogenase OS=bacterium YEK0313 OX=1522316 GN=leuB_2 PE=3 SV=1
MM1 pKa = 7.44SLNDD5 pKa = 3.17AHH7 pKa = 7.08AFAFSLATTLMAAIVIFQAGDD28 pKa = 3.41GTLSVAPASEE38 pKa = 4.18YY39 pKa = 11.14DD40 pKa = 3.44GDD42 pKa = 3.77ASEE45 pKa = 5.46IIHH48 pKa = 6.77EE49 pKa = 4.69IDD51 pKa = 3.29PFAPP55 pKa = 3.85
MM1 pKa = 7.44SLNDD5 pKa = 3.17AHH7 pKa = 7.08AFAFSLATTLMAAIVIFQAGDD28 pKa = 3.41GTLSVAPASEE38 pKa = 4.18YY39 pKa = 11.14DD40 pKa = 3.44GDD42 pKa = 3.77ASEE45 pKa = 5.46IIHH48 pKa = 6.77EE49 pKa = 4.69IDD51 pKa = 3.29PFAPP55 pKa = 3.85
Molecular weight: 5.71 kDa
Isoelectric point according different methods:
Protein with the highest isoelectric point:
>tr|A0A0A1Q284|A0A0A1Q284_9BACT OMP_b-brl domain-containing protein OS=bacterium YEK0313 OX=1522316 GN=BN1110_06233 PE=4 SV=1
MM1 pKa = 7.35KK2 pKa = 9.43RR3 pKa = 11.84TYY5 pKa = 10.27QPSKK9 pKa = 9.73LVRR12 pKa = 11.84KK13 pKa = 9.15RR14 pKa = 11.84RR15 pKa = 11.84HH16 pKa = 4.42GFRR19 pKa = 11.84ARR21 pKa = 11.84MATKK25 pKa = 10.08GGQRR29 pKa = 11.84VLAARR34 pKa = 11.84RR35 pKa = 11.84ARR37 pKa = 11.84GRR39 pKa = 11.84KK40 pKa = 9.03RR41 pKa = 11.84LSAA44 pKa = 4.03
MM1 pKa = 7.35KK2 pKa = 9.43RR3 pKa = 11.84TYY5 pKa = 10.27QPSKK9 pKa = 9.73LVRR12 pKa = 11.84KK13 pKa = 9.15RR14 pKa = 11.84RR15 pKa = 11.84HH16 pKa = 4.42GFRR19 pKa = 11.84ARR21 pKa = 11.84MATKK25 pKa = 10.08GGQRR29 pKa = 11.84VLAARR34 pKa = 11.84RR35 pKa = 11.84ARR37 pKa = 11.84GRR39 pKa = 11.84KK40 pKa = 9.03RR41 pKa = 11.84LSAA44 pKa = 4.03
Molecular weight: 5.17 kDa
Isoelectric point according different methods:
Peptides (in silico digests for buttom-up proteomics)
Below you can find in silico digests of the whole proteome with Trypsin, Chymotrypsin, Trypsin+LysC, LysN, ArgC proteases suitable for different mass spec machines.| Try ESI |
 |
|---|
| ChTry ESI |
|
|---|
| ArgC ESI |
|
|---|
| LysN ESI |
|
|---|
| TryLysC ESI |
|
|---|
| Try MALDI |
|
|---|
| ChTry MALDI |
|
|---|
| ArgC MALDI |
|
|---|
| LysN MALDI |
|
|---|
| TryLysC MALDI |
|
|---|
| Try LTQ |
|
|---|
| ChTry LTQ |
|
|---|
| ArgC LTQ |
|
|---|
| LysN LTQ |
|
|---|
| TryLysC LTQ |
|
|---|
| Try MSlow |
|
|---|
| ChTry MSlow |
|
|---|
| ArgC MSlow |
|
|---|
| LysN MSlow |
|
|---|
| TryLysC MSlow |
|
|---|
| Try MShigh |
|
|---|
| ChTry MShigh |
|
|---|
| ArgC MShigh |
|
|---|
| LysN MShigh |
|
|---|
| TryLysC MShigh |
|
|---|
General Statistics
Number of major isoforms |
Number of additional isoforms |
Number of all proteins |
Number of amino acids |
Min. Seq. Length |
Max. Seq. Length |
Avg. Seq. Length |
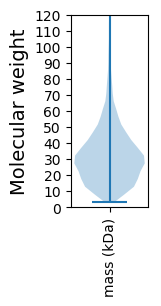
Avg. Mol. Weight |
|---|---|---|---|---|---|---|---|
0 |
2090780 |
29 |
4478 |
318.6 |
34.22 |
Amino acid frequency
Ala |
Cys |
Asp |
Glu |
Phe |
Gly |
His |
Ile |
Lys |
Leu |
|---|---|---|---|---|---|---|---|---|---|
14.239 ± 0.049 | 0.769 ± 0.009 |
5.393 ± 0.027 | 5.157 ± 0.029 |
3.67 ± 0.019 | 9.177 ± 0.045 |
1.975 ± 0.015 | 4.949 ± 0.021 |
2.507 ± 0.023 | 10.207 ± 0.04 |
Met |
Asn |
Gln |
Pro |
Arg |
Ser |
Thr |
Val |
Trp |
Tyr |
|---|---|---|---|---|---|---|---|---|---|
2.37 ± 0.015 | 2.221 ± 0.021 |
5.464 ± 0.026 | 2.846 ± 0.019 |
7.917 ± 0.037 | 4.8 ± 0.022 |
5.277 ± 0.029 | 7.723 ± 0.023 |
1.31 ± 0.011 | 2.03 ± 0.014 |
Most of the basic statistics you can see at this page can be downloaded from this CSV file
See this proteome in:

Proteome-pI is available under Creative Commons Attribution-NoDerivs license, for more details see here
| Reference: Kozlowski LP. Proteome-pI 2.0: Proteome Isoelectric Point Database Update. Nucleic Acids Res. 2021, doi: 10.1093/nar/gkab944 | Contact: Lukasz P. Kozlowski |