Micromonospora fluostatini
Taxonomy: cellular organisms; Bacteria; Terrabacteria group; Actinobacteria; Actinomycetia; Micromonosporales; Micromonosporaceae; Micromonospora
Average proteome isoelectric point is 6.58
Get precalculated fractions of proteins
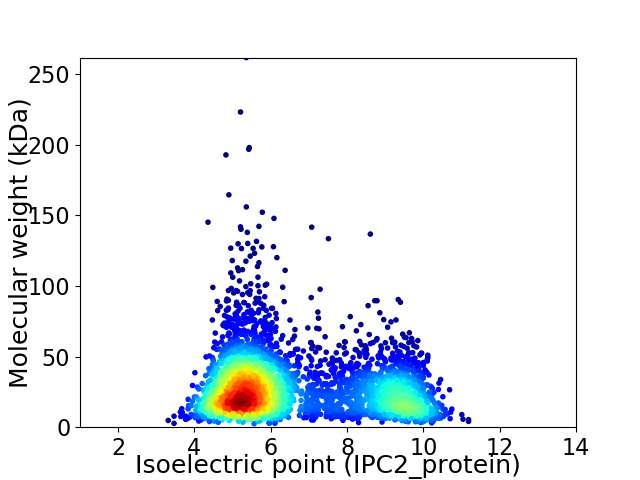
Virtual 2D-PAGE plot for 3712 proteins (isoelectric point calculated using IPC2_protein)
Get csv file with sequences according to given criteria:
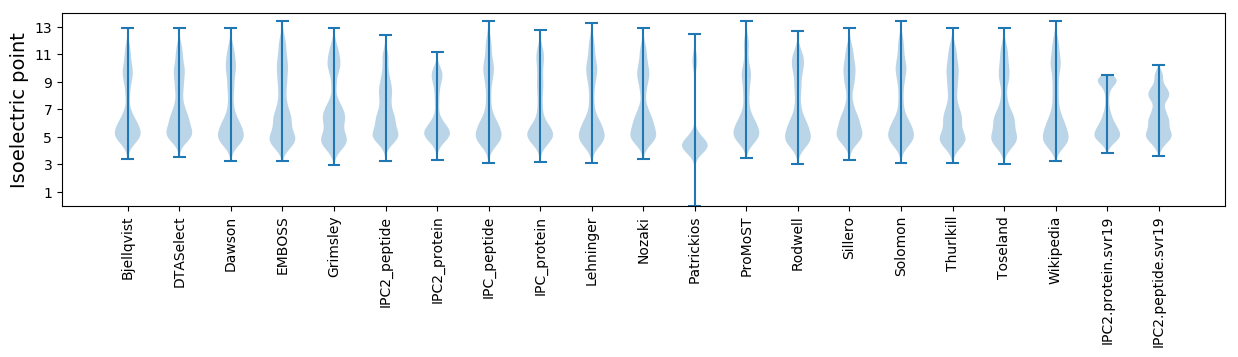
* You can choose from 21 different methods for calculating isoelectric point
Summary statistics related to proteome-wise predictions
Protein with the lowest isoelectric point:
>tr|A0A4V2XJH0|A0A4V2XJH0_9ACTN PH domain-containing protein OS=Micromonospora fluostatini OX=1629071 GN=E1091_00480 PE=4 SV=1
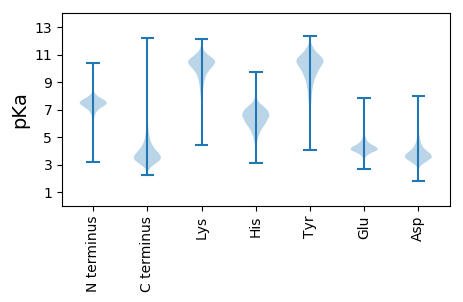
MM1 pKa = 7.11STTIAATAPEE11 pKa = 4.62TGPDD15 pKa = 3.79DD16 pKa = 6.18LFDD19 pKa = 6.15LDD21 pKa = 3.66ISVIEE26 pKa = 4.34SGPVIPEE33 pKa = 4.35LLRR36 pKa = 11.84STSDD40 pKa = 3.17NCGGTCASACTSCKK54 pKa = 10.31SS55 pKa = 3.16
MM1 pKa = 7.11STTIAATAPEE11 pKa = 4.62TGPDD15 pKa = 3.79DD16 pKa = 6.18LFDD19 pKa = 6.15LDD21 pKa = 3.66ISVIEE26 pKa = 4.34SGPVIPEE33 pKa = 4.35LLRR36 pKa = 11.84STSDD40 pKa = 3.17NCGGTCASACTSCKK54 pKa = 10.31SS55 pKa = 3.16
Molecular weight: 5.55 kDa
Isoelectric point according different methods:
Protein with the highest isoelectric point:
>tr|A0A4R4MFL3|A0A4R4MFL3_9ACTN Transcriptional regulator OS=Micromonospora fluostatini OX=1629071 GN=E1091_12585 PE=4 SV=1
MM1 pKa = 7.28GSVVKK6 pKa = 10.49KK7 pKa = 9.45RR8 pKa = 11.84RR9 pKa = 11.84KK10 pKa = 9.48RR11 pKa = 11.84MAKK14 pKa = 9.41KK15 pKa = 9.87KK16 pKa = 9.7HH17 pKa = 5.84RR18 pKa = 11.84KK19 pKa = 8.7LLRR22 pKa = 11.84KK23 pKa = 7.84TRR25 pKa = 11.84VQRR28 pKa = 11.84RR29 pKa = 11.84RR30 pKa = 11.84LGKK33 pKa = 10.04
MM1 pKa = 7.28GSVVKK6 pKa = 10.49KK7 pKa = 9.45RR8 pKa = 11.84RR9 pKa = 11.84KK10 pKa = 9.48RR11 pKa = 11.84MAKK14 pKa = 9.41KK15 pKa = 9.87KK16 pKa = 9.7HH17 pKa = 5.84RR18 pKa = 11.84KK19 pKa = 8.7LLRR22 pKa = 11.84KK23 pKa = 7.84TRR25 pKa = 11.84VQRR28 pKa = 11.84RR29 pKa = 11.84RR30 pKa = 11.84LGKK33 pKa = 10.04
Molecular weight: 4.12 kDa
Isoelectric point according different methods:
Peptides (in silico digests for buttom-up proteomics)
Below you can find in silico digests of the whole proteome with Trypsin, Chymotrypsin, Trypsin+LysC, LysN, ArgC proteases suitable for different mass spec machines.| Try ESI |
 |
|---|
| ChTry ESI |
|
|---|
| ArgC ESI |
|
|---|
| LysN ESI |
|
|---|
| TryLysC ESI |
|
|---|
| Try MALDI |
|
|---|
| ChTry MALDI |
|
|---|
| ArgC MALDI |
|
|---|
| LysN MALDI |
|
|---|
| TryLysC MALDI |
|
|---|
| Try LTQ |
|
|---|
| ChTry LTQ |
|
|---|
| ArgC LTQ |
|
|---|
| LysN LTQ |
|
|---|
| TryLysC LTQ |
|
|---|
| Try MSlow |
|
|---|
| ChTry MSlow |
|
|---|
| ArgC MSlow |
|
|---|
| LysN MSlow |
|
|---|
| TryLysC MSlow |
|
|---|
| Try MShigh |
|
|---|
| ChTry MShigh |
|
|---|
| ArgC MShigh |
|
|---|
| LysN MShigh |
|
|---|
| TryLysC MShigh |
|
|---|
General Statistics
Number of major isoforms |
Number of additional isoforms |
Number of all proteins |
Number of amino acids |
Min. Seq. Length |
Max. Seq. Length |
Avg. Seq. Length |
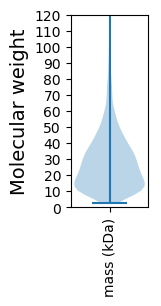
Avg. Mol. Weight |
|---|---|---|---|---|---|---|---|
0 |
1024851 |
22 |
2467 |
276.1 |
29.65 |
Amino acid frequency
Ala |
Cys |
Asp |
Glu |
Phe |
Gly |
His |
Ile |
Lys |
Leu |
|---|---|---|---|---|---|---|---|---|---|
13.506 ± 0.065 | 0.756 ± 0.012 |
6.162 ± 0.037 | 5.189 ± 0.037 |
2.693 ± 0.024 | 9.275 ± 0.042 |
2.261 ± 0.024 | 3.143 ± 0.032 |
1.658 ± 0.03 | 10.502 ± 0.05 |
Met |
Asn |
Gln |
Pro |
Arg |
Ser |
Thr |
Val |
Trp |
Tyr |
|---|---|---|---|---|---|---|---|---|---|
1.626 ± 0.016 | 1.814 ± 0.027 |
6.09 ± 0.036 | 2.833 ± 0.024 |
8.62 ± 0.049 | 4.554 ± 0.033 |
6.318 ± 0.033 | 9.207 ± 0.037 |
1.604 ± 0.017 | 2.188 ± 0.019 |
Most of the basic statistics you can see at this page can be downloaded from this CSV file
See this proteome in:

Proteome-pI is available under Creative Commons Attribution-NoDerivs license, for more details see here
| Reference: Kozlowski LP. Proteome-pI 2.0: Proteome Isoelectric Point Database Update. Nucleic Acids Res. 2021, doi: 10.1093/nar/gkab944 | Contact: Lukasz P. Kozlowski |