Torulaspora delbrueckii (strain ATCC 10662 / CBS 1146 / NBRC 0425 / NCYC 2629 / NRRL Y-866) (Yeast) (Candida colliculosa)
Taxonomy: cellular organisms; Eukaryota; Opisthokonta; Fungi; Dikarya; Ascomycota; saccharomyceta; Saccharomycotina; Saccharomycetes; Saccharomycetales; Saccharomycetaceae; Torulaspora; Torulaspora delbrueckii
Average proteome isoelectric point is 6.46
Get precalculated fractions of proteins
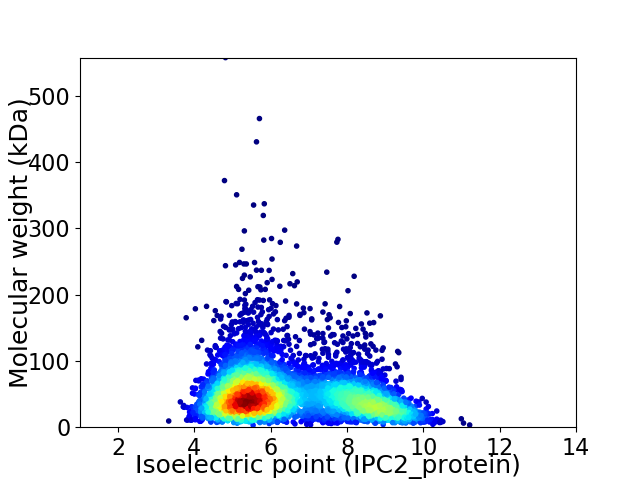
Virtual 2D-PAGE plot for 4966 proteins (isoelectric point calculated using IPC2_protein)
Get csv file with sequences according to given criteria:
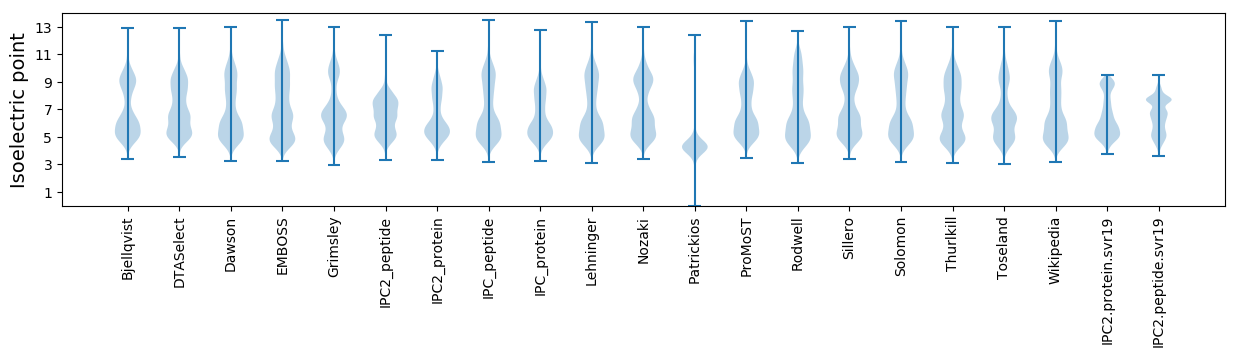
* You can choose from 21 different methods for calculating isoelectric point
Summary statistics related to proteome-wise predictions
Protein with the lowest isoelectric point:
>tr|G8ZTG6|G8ZTG6_TORDC UBC core domain-containing protein OS=Torulaspora delbrueckii (strain ATCC 10662 / CBS 1146 / NBRC 0425 / NCYC 2629 / NRRL Y-866) OX=1076872 GN=TDEL0D03260 PE=3 SV=1
MM1 pKa = 7.36NPITVLFHH9 pKa = 6.81LALAYY14 pKa = 9.72TSFTGIDD21 pKa = 3.57LADD24 pKa = 3.81ASAVDD29 pKa = 3.89VEE31 pKa = 4.77VVTDD35 pKa = 3.7QVSKK39 pKa = 9.98VTIDD43 pKa = 3.65LNQLMDD49 pKa = 3.56QAGTNSEE56 pKa = 4.27SSDD59 pKa = 3.13ASAKK63 pKa = 9.0VLSYY67 pKa = 10.46IVNSDD72 pKa = 3.61SPVNSVVEE80 pKa = 4.6AYY82 pKa = 9.89DD83 pKa = 3.52AAIDD87 pKa = 4.14AGDD90 pKa = 3.41ISLATVYY97 pKa = 8.87ATKK100 pKa = 10.86LMGLIEE106 pKa = 4.49SVDD109 pKa = 3.78DD110 pKa = 4.92LISDD114 pKa = 4.19IYY116 pKa = 10.9AAPDD120 pKa = 3.7YY121 pKa = 10.43YY122 pKa = 11.42SEE124 pKa = 5.32IIPKK128 pKa = 9.71QLITGAASQLAKK140 pKa = 10.07RR141 pKa = 11.84DD142 pKa = 3.69QVDD145 pKa = 3.23NDD147 pKa = 3.23ATRR150 pKa = 11.84VLDD153 pKa = 3.89ALLNIMGTNATAQSNQLDD171 pKa = 4.16DD172 pKa = 3.88GTTGLVRR179 pKa = 11.84RR180 pKa = 11.84DD181 pKa = 2.98QCGNYY186 pKa = 10.01NVDD189 pKa = 3.25TSNVVALSVFNSMRR203 pKa = 11.84GQIDD207 pKa = 3.61GNMWYY212 pKa = 9.78PNDD215 pKa = 3.54PRR217 pKa = 11.84NFCRR221 pKa = 11.84WYY223 pKa = 9.92EE224 pKa = 3.94DD225 pKa = 3.54LRR227 pKa = 11.84GCISWSTDD235 pKa = 3.04VGGMPGNALQSWAADD250 pKa = 3.5MSNCIPDD257 pKa = 3.83AHH259 pKa = 6.5PKK261 pKa = 9.59SLKK264 pKa = 10.34SLFAFGVSQGSTYY277 pKa = 10.66VCGSGRR283 pKa = 11.84PDD285 pKa = 2.95GCC287 pKa = 4.42
MM1 pKa = 7.36NPITVLFHH9 pKa = 6.81LALAYY14 pKa = 9.72TSFTGIDD21 pKa = 3.57LADD24 pKa = 3.81ASAVDD29 pKa = 3.89VEE31 pKa = 4.77VVTDD35 pKa = 3.7QVSKK39 pKa = 9.98VTIDD43 pKa = 3.65LNQLMDD49 pKa = 3.56QAGTNSEE56 pKa = 4.27SSDD59 pKa = 3.13ASAKK63 pKa = 9.0VLSYY67 pKa = 10.46IVNSDD72 pKa = 3.61SPVNSVVEE80 pKa = 4.6AYY82 pKa = 9.89DD83 pKa = 3.52AAIDD87 pKa = 4.14AGDD90 pKa = 3.41ISLATVYY97 pKa = 8.87ATKK100 pKa = 10.86LMGLIEE106 pKa = 4.49SVDD109 pKa = 3.78DD110 pKa = 4.92LISDD114 pKa = 4.19IYY116 pKa = 10.9AAPDD120 pKa = 3.7YY121 pKa = 10.43YY122 pKa = 11.42SEE124 pKa = 5.32IIPKK128 pKa = 9.71QLITGAASQLAKK140 pKa = 10.07RR141 pKa = 11.84DD142 pKa = 3.69QVDD145 pKa = 3.23NDD147 pKa = 3.23ATRR150 pKa = 11.84VLDD153 pKa = 3.89ALLNIMGTNATAQSNQLDD171 pKa = 4.16DD172 pKa = 3.88GTTGLVRR179 pKa = 11.84RR180 pKa = 11.84DD181 pKa = 2.98QCGNYY186 pKa = 10.01NVDD189 pKa = 3.25TSNVVALSVFNSMRR203 pKa = 11.84GQIDD207 pKa = 3.61GNMWYY212 pKa = 9.78PNDD215 pKa = 3.54PRR217 pKa = 11.84NFCRR221 pKa = 11.84WYY223 pKa = 9.92EE224 pKa = 3.94DD225 pKa = 3.54LRR227 pKa = 11.84GCISWSTDD235 pKa = 3.04VGGMPGNALQSWAADD250 pKa = 3.5MSNCIPDD257 pKa = 3.83AHH259 pKa = 6.5PKK261 pKa = 9.59SLKK264 pKa = 10.34SLFAFGVSQGSTYY277 pKa = 10.66VCGSGRR283 pKa = 11.84PDD285 pKa = 2.95GCC287 pKa = 4.42
Molecular weight: 30.72 kDa
Isoelectric point according different methods:
Protein with the highest isoelectric point:
>tr|G8ZZK0|G8ZZK0_TORDC Topoisomerase I damage affected protein 2 OS=Torulaspora delbrueckii (strain ATCC 10662 / CBS 1146 / NBRC 0425 / NCYC 2629 / NRRL Y-866) OX=1076872 GN=TDEL0H01850 PE=3 SV=1
MM1 pKa = 7.1RR2 pKa = 11.84AKK4 pKa = 9.09WRR6 pKa = 11.84KK7 pKa = 8.87KK8 pKa = 8.73RR9 pKa = 11.84VRR11 pKa = 11.84RR12 pKa = 11.84LKK14 pKa = 9.71RR15 pKa = 11.84KK16 pKa = 8.27RR17 pKa = 11.84RR18 pKa = 11.84KK19 pKa = 9.19VRR21 pKa = 11.84ARR23 pKa = 11.84SKK25 pKa = 10.98
MM1 pKa = 7.1RR2 pKa = 11.84AKK4 pKa = 9.09WRR6 pKa = 11.84KK7 pKa = 8.87KK8 pKa = 8.73RR9 pKa = 11.84VRR11 pKa = 11.84RR12 pKa = 11.84LKK14 pKa = 9.71RR15 pKa = 11.84KK16 pKa = 8.27RR17 pKa = 11.84RR18 pKa = 11.84KK19 pKa = 9.19VRR21 pKa = 11.84ARR23 pKa = 11.84SKK25 pKa = 10.98
Molecular weight: 3.34 kDa
Isoelectric point according different methods:
Peptides (in silico digests for buttom-up proteomics)
Below you can find in silico digests of the whole proteome with Trypsin, Chymotrypsin, Trypsin+LysC, LysN, ArgC proteases suitable for different mass spec machines.| Try ESI |
 |
|---|
| ChTry ESI |
|
|---|
| ArgC ESI |
|
|---|
| LysN ESI |
|
|---|
| TryLysC ESI |
|
|---|
| Try MALDI |
|
|---|
| ChTry MALDI |
|
|---|
| ArgC MALDI |
|
|---|
| LysN MALDI |
|
|---|
| TryLysC MALDI |
|
|---|
| Try LTQ |
|
|---|
| ChTry LTQ |
|
|---|
| ArgC LTQ |
|
|---|
| LysN LTQ |
|
|---|
| TryLysC LTQ |
|
|---|
| Try MSlow |
|
|---|
| ChTry MSlow |
|
|---|
| ArgC MSlow |
|
|---|
| LysN MSlow |
|
|---|
| TryLysC MSlow |
|
|---|
| Try MShigh |
|
|---|
| ChTry MShigh |
|
|---|
| ArgC MShigh |
|
|---|
| LysN MShigh |
|
|---|
| TryLysC MShigh |
|
|---|
General Statistics
Number of major isoforms |
Number of additional isoforms |
Number of all proteins |
Number of amino acids |
Min. Seq. Length |
Max. Seq. Length |
Avg. Seq. Length |
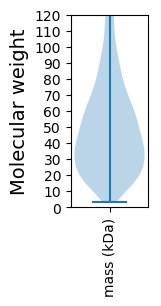
Avg. Mol. Weight |
|---|---|---|---|---|---|---|---|
0 |
2412323 |
25 |
4909 |
485.8 |
54.8 |
Amino acid frequency
Ala |
Cys |
Asp |
Glu |
Phe |
Gly |
His |
Ile |
Lys |
Leu |
|---|---|---|---|---|---|---|---|---|---|
6.124 ± 0.029 | 1.297 ± 0.012 |
5.973 ± 0.022 | 6.859 ± 0.032 |
4.299 ± 0.023 | 5.387 ± 0.026 |
2.148 ± 0.012 | 5.874 ± 0.023 |
6.889 ± 0.031 | 9.748 ± 0.036 |
Met |
Asn |
Gln |
Pro |
Arg |
Ser |
Thr |
Val |
Trp |
Tyr |
|---|---|---|---|---|---|---|---|---|---|
2.129 ± 0.013 | 5.066 ± 0.02 |
4.408 ± 0.026 | 4.182 ± 0.026 |
4.93 ± 0.021 | 8.647 ± 0.037 |
5.551 ± 0.029 | 6.12 ± 0.023 |
1.084 ± 0.01 | 3.282 ± 0.017 |
Most of the basic statistics you can see at this page can be downloaded from this CSV file
See this proteome in:

Proteome-pI is available under Creative Commons Attribution-NoDerivs license, for more details see here
| Reference: Kozlowski LP. Proteome-pI 2.0: Proteome Isoelectric Point Database Update. Nucleic Acids Res. 2021, doi: 10.1093/nar/gkab944 | Contact: Lukasz P. Kozlowski |