Azospira oryzae (strain ATCC BAA-33 / DSM 13638 / PS) (Dechlorosoma suillum)
Taxonomy: cellular organisms; Bacteria; Proteobacteria; Betaproteobacteria; Rhodocyclales; Rhodocyclaceae; Azospira; Azospira oryzae
Average proteome isoelectric point is 6.64
Get precalculated fractions of proteins
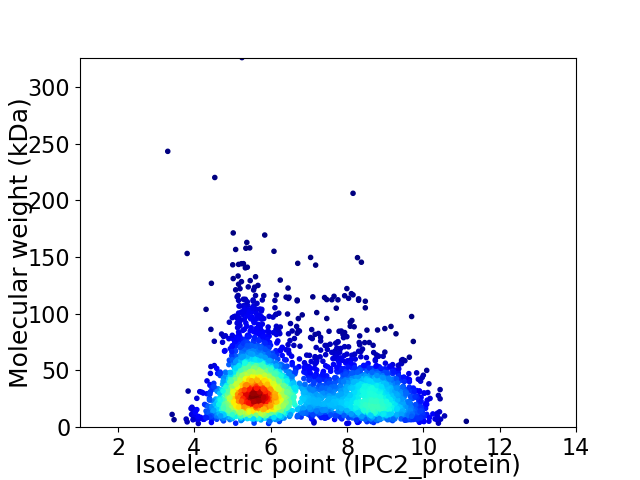
Virtual 2D-PAGE plot for 3432 proteins (isoelectric point calculated using IPC2_protein)
Get csv file with sequences according to given criteria:
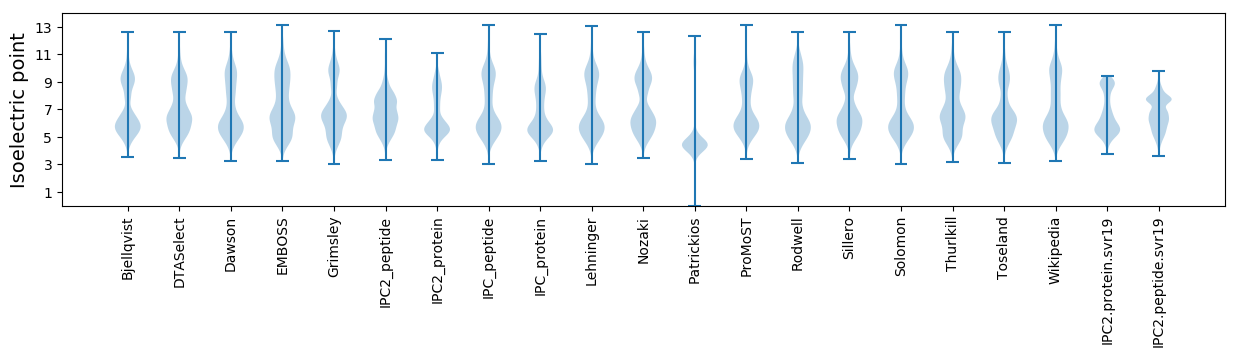
* You can choose from 21 different methods for calculating isoelectric point
Summary statistics related to proteome-wise predictions
Protein with the lowest isoelectric point:
>tr|G8QNY1|G8QNY1_AZOOP Elongation factor G OS=Azospira oryzae (strain ATCC BAA-33 / DSM 13638 / PS) OX=640081 GN=fusA PE=3 SV=1
MM1 pKa = 7.43EE2 pKa = 4.81VNGSNAYY9 pKa = 9.24VHH11 pKa = 7.78DD12 pKa = 4.3YY13 pKa = 10.48MLTGPALVSGGLISDD28 pKa = 5.06GIEE31 pKa = 3.65ADD33 pKa = 4.27FVADD37 pKa = 3.47VAGQVDD43 pKa = 3.85AARR46 pKa = 4.34
MM1 pKa = 7.43EE2 pKa = 4.81VNGSNAYY9 pKa = 9.24VHH11 pKa = 7.78DD12 pKa = 4.3YY13 pKa = 10.48MLTGPALVSGGLISDD28 pKa = 5.06GIEE31 pKa = 3.65ADD33 pKa = 4.27FVADD37 pKa = 3.47VAGQVDD43 pKa = 3.85AARR46 pKa = 4.34
Molecular weight: 4.7 kDa
Isoelectric point according different methods:
Protein with the highest isoelectric point:
>tr|G8QHU6|G8QHU6_AZOOP Acetolactate synthase OS=Azospira oryzae (strain ATCC BAA-33 / DSM 13638 / PS) OX=640081 GN=Dsui_1926 PE=3 SV=1
MM1 pKa = 7.35KK2 pKa = 9.36RR3 pKa = 11.84TYY5 pKa = 9.97QPSVVRR11 pKa = 11.84RR12 pKa = 11.84KK13 pKa = 8.6RR14 pKa = 11.84THH16 pKa = 5.75GFLVRR21 pKa = 11.84MKK23 pKa = 9.4TKK25 pKa = 10.3GGRR28 pKa = 11.84AVIRR32 pKa = 11.84ARR34 pKa = 11.84RR35 pKa = 11.84AKK37 pKa = 9.67GRR39 pKa = 11.84KK40 pKa = 8.75RR41 pKa = 11.84LAVV44 pKa = 3.41
MM1 pKa = 7.35KK2 pKa = 9.36RR3 pKa = 11.84TYY5 pKa = 9.97QPSVVRR11 pKa = 11.84RR12 pKa = 11.84KK13 pKa = 8.6RR14 pKa = 11.84THH16 pKa = 5.75GFLVRR21 pKa = 11.84MKK23 pKa = 9.4TKK25 pKa = 10.3GGRR28 pKa = 11.84AVIRR32 pKa = 11.84ARR34 pKa = 11.84RR35 pKa = 11.84AKK37 pKa = 9.67GRR39 pKa = 11.84KK40 pKa = 8.75RR41 pKa = 11.84LAVV44 pKa = 3.41
Molecular weight: 5.18 kDa
Isoelectric point according different methods:
Peptides (in silico digests for buttom-up proteomics)
Below you can find in silico digests of the whole proteome with Trypsin, Chymotrypsin, Trypsin+LysC, LysN, ArgC proteases suitable for different mass spec machines.| Try ESI |
 |
|---|
| ChTry ESI |
|
|---|
| ArgC ESI |
|
|---|
| LysN ESI |
|
|---|
| TryLysC ESI |
|
|---|
| Try MALDI |
|
|---|
| ChTry MALDI |
|
|---|
| ArgC MALDI |
|
|---|
| LysN MALDI |
|
|---|
| TryLysC MALDI |
|
|---|
| Try LTQ |
|
|---|
| ChTry LTQ |
|
|---|
| ArgC LTQ |
|
|---|
| LysN LTQ |
|
|---|
| TryLysC LTQ |
|
|---|
| Try MSlow |
|
|---|
| ChTry MSlow |
|
|---|
| ArgC MSlow |
|
|---|
| LysN MSlow |
|
|---|
| TryLysC MSlow |
|
|---|
| Try MShigh |
|
|---|
| ChTry MShigh |
|
|---|
| ArgC MShigh |
|
|---|
| LysN MShigh |
|
|---|
| TryLysC MShigh |
|
|---|
General Statistics
Number of major isoforms |
Number of additional isoforms |
Number of all proteins |
Number of amino acids |
Min. Seq. Length |
Max. Seq. Length |
Avg. Seq. Length |
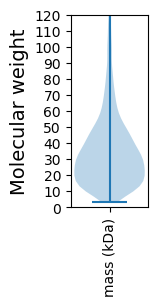
Avg. Mol. Weight |
|---|---|---|---|---|---|---|---|
0 |
1138217 |
29 |
2936 |
331.6 |
36.15 |
Amino acid frequency
Ala |
Cys |
Asp |
Glu |
Phe |
Gly |
His |
Ile |
Lys |
Leu |
|---|---|---|---|---|---|---|---|---|---|
12.309 ± 0.059 | 0.97 ± 0.015 |
5.132 ± 0.028 | 6.117 ± 0.041 |
3.543 ± 0.024 | 8.23 ± 0.039 |
2.19 ± 0.019 | 4.5 ± 0.033 |
3.714 ± 0.047 | 11.438 ± 0.059 |
Met |
Asn |
Gln |
Pro |
Arg |
Ser |
Thr |
Val |
Trp |
Tyr |
|---|---|---|---|---|---|---|---|---|---|
2.237 ± 0.018 | 2.776 ± 0.031 |
5.185 ± 0.037 | 4.067 ± 0.026 |
6.78 ± 0.044 | 5.223 ± 0.035 |
4.698 ± 0.046 | 7.214 ± 0.037 |
1.343 ± 0.018 | 2.335 ± 0.02 |
Most of the basic statistics you can see at this page can be downloaded from this CSV file
See this proteome in:

Proteome-pI is available under Creative Commons Attribution-NoDerivs license, for more details see here
| Reference: Kozlowski LP. Proteome-pI 2.0: Proteome Isoelectric Point Database Update. Nucleic Acids Res. 2021, doi: 10.1093/nar/gkab944 | Contact: Lukasz P. Kozlowski |