Escherichia phage vB_EcoS_HdSG1
Taxonomy: Viruses; Duplodnaviria; Heunggongvirae; Uroviricota; Caudoviricetes; Caudovirales; Siphoviridae; Queuovirinae; Nonagvirus; unclassified Nonagvirus
Average proteome isoelectric point is 6.36
Get precalculated fractions of proteins
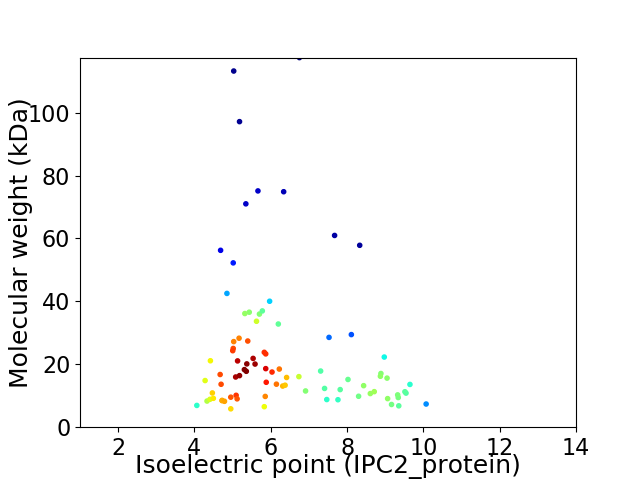
Virtual 2D-PAGE plot for 86 proteins (isoelectric point calculated using IPC2_protein)
Get csv file with sequences according to given criteria:
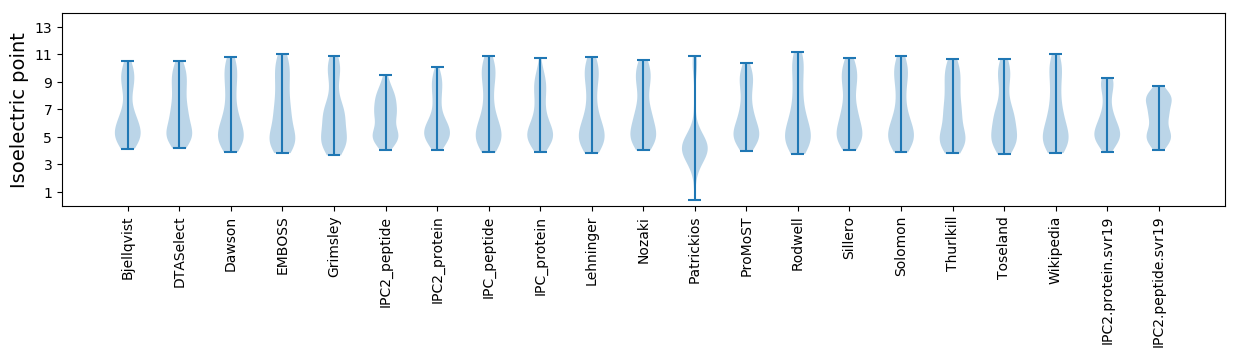
* You can choose from 21 different methods for calculating isoelectric point
Summary statistics related to proteome-wise predictions
Protein with the lowest isoelectric point:
>tr|A0A482N582|A0A482N582_9CAUD Uncharacterized protein OS=Escherichia phage vB_EcoS_HdSG1 OX=2508191 GN=HdSG1_00013 PE=4 SV=1
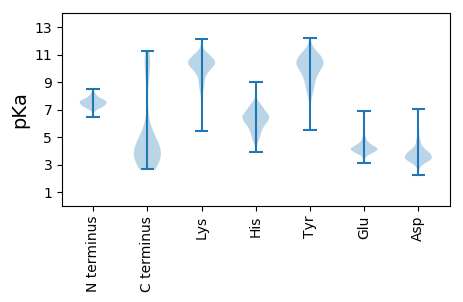
MM1 pKa = 6.89EE2 pKa = 5.56TIVLNCWVDD11 pKa = 3.71LDD13 pKa = 3.72EE14 pKa = 6.87HH15 pKa = 6.58EE16 pKa = 4.49YY17 pKa = 10.79CVNINNGPVPDD28 pKa = 4.08ATFASYY34 pKa = 11.5DD35 pKa = 3.51EE36 pKa = 3.86MDD38 pKa = 3.95AYY40 pKa = 11.45VKK42 pKa = 10.46GFRR45 pKa = 11.84EE46 pKa = 4.39CARR49 pKa = 11.84LANINVTVILPEE61 pKa = 3.82
MM1 pKa = 6.89EE2 pKa = 5.56TIVLNCWVDD11 pKa = 3.71LDD13 pKa = 3.72EE14 pKa = 6.87HH15 pKa = 6.58EE16 pKa = 4.49YY17 pKa = 10.79CVNINNGPVPDD28 pKa = 4.08ATFASYY34 pKa = 11.5DD35 pKa = 3.51EE36 pKa = 3.86MDD38 pKa = 3.95AYY40 pKa = 11.45VKK42 pKa = 10.46GFRR45 pKa = 11.84EE46 pKa = 4.39CARR49 pKa = 11.84LANINVTVILPEE61 pKa = 3.82
Molecular weight: 6.92 kDa
Isoelectric point according different methods:
Protein with the highest isoelectric point:
>tr|A0A482N806|A0A482N806_9CAUD Uncharacterized protein OS=Escherichia phage vB_EcoS_HdSG1 OX=2508191 GN=HdSG1_00086 PE=4 SV=1
MM1 pKa = 7.32QKK3 pKa = 9.51HH4 pKa = 4.17QPLYY8 pKa = 9.88KK9 pKa = 9.88VRR11 pKa = 11.84RR12 pKa = 11.84LGGGLYY18 pKa = 10.3AVEE21 pKa = 4.05RR22 pKa = 11.84NKK24 pKa = 10.74RR25 pKa = 11.84SITIVSVKK33 pKa = 9.8VGSRR37 pKa = 11.84KK38 pKa = 9.39FYY40 pKa = 10.85SVPNCSPLLPTLRR53 pKa = 11.84DD54 pKa = 3.11AVLYY58 pKa = 10.52VLTGTFFF65 pKa = 4.14
MM1 pKa = 7.32QKK3 pKa = 9.51HH4 pKa = 4.17QPLYY8 pKa = 9.88KK9 pKa = 9.88VRR11 pKa = 11.84RR12 pKa = 11.84LGGGLYY18 pKa = 10.3AVEE21 pKa = 4.05RR22 pKa = 11.84NKK24 pKa = 10.74RR25 pKa = 11.84SITIVSVKK33 pKa = 9.8VGSRR37 pKa = 11.84KK38 pKa = 9.39FYY40 pKa = 10.85SVPNCSPLLPTLRR53 pKa = 11.84DD54 pKa = 3.11AVLYY58 pKa = 10.52VLTGTFFF65 pKa = 4.14
Molecular weight: 7.37 kDa
Isoelectric point according different methods:
Peptides (in silico digests for buttom-up proteomics)
Below you can find in silico digests of the whole proteome with Trypsin, Chymotrypsin, Trypsin+LysC, LysN, ArgC proteases suitable for different mass spec machines.| Try ESI |
 |
|---|
| ChTry ESI |
|
|---|
| ArgC ESI |
|
|---|
| LysN ESI |
|
|---|
| TryLysC ESI |
|
|---|
| Try MALDI |
|
|---|
| ChTry MALDI |
|
|---|
| ArgC MALDI |
|
|---|
| LysN MALDI |
|
|---|
| TryLysC MALDI |
|
|---|
| Try LTQ |
|
|---|
| ChTry LTQ |
|
|---|
| ArgC LTQ |
|
|---|
| LysN LTQ |
|
|---|
| TryLysC LTQ |
|
|---|
| Try MSlow |
|
|---|
| ChTry MSlow |
|
|---|
| ArgC MSlow |
|
|---|
| LysN MSlow |
|
|---|
| TryLysC MSlow |
|
|---|
| Try MShigh |
|
|---|
| ChTry MShigh |
|
|---|
| ArgC MShigh |
|
|---|
| LysN MShigh |
|
|---|
| TryLysC MShigh |
|
|---|
General Statistics
Number of major isoforms |
Number of additional isoforms |
Number of all proteins |
Number of amino acids |
Min. Seq. Length |
Max. Seq. Length |
Avg. Seq. Length |
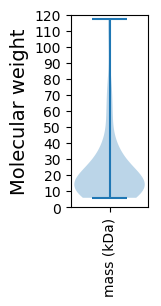
Avg. Mol. Weight |
|---|---|---|---|---|---|---|---|
0 |
18612 |
47 |
1086 |
216.4 |
24.14 |
Amino acid frequency
Ala |
Cys |
Asp |
Glu |
Phe |
Gly |
His |
Ile |
Lys |
Leu |
|---|---|---|---|---|---|---|---|---|---|
8.387 ± 0.615 | 1.397 ± 0.148 |
5.668 ± 0.207 | 6.576 ± 0.31 |
3.476 ± 0.181 | 7.162 ± 0.302 |
1.907 ± 0.172 | 6.034 ± 0.161 |
6.055 ± 0.264 | 7.345 ± 0.235 |
Met |
Asn |
Gln |
Pro |
Arg |
Ser |
Thr |
Val |
Trp |
Tyr |
|---|---|---|---|---|---|---|---|---|---|
2.891 ± 0.171 | 4.959 ± 0.178 |
4.051 ± 0.238 | 4.696 ± 0.376 |
5.061 ± 0.217 | 6.163 ± 0.282 |
6.179 ± 0.278 | 7.028 ± 0.24 |
1.424 ± 0.106 | 3.541 ± 0.175 |
Most of the basic statistics you can see at this page can be downloaded from this CSV file
See this proteome in:

Proteome-pI is available under Creative Commons Attribution-NoDerivs license, for more details see here
| Reference: Kozlowski LP. Proteome-pI 2.0: Proteome Isoelectric Point Database Update. Nucleic Acids Res. 2021, doi: 10.1093/nar/gkab944 | Contact: Lukasz P. Kozlowski |