Mycobacterium phage Bones
Taxonomy: Viruses; Duplodnaviria; Heunggongvirae; Uroviricota; Caudoviricetes; Caudovirales; Siphoviridae; Fromanvirus; unclassified Fromanvirus
Average proteome isoelectric point is 6.31
Get precalculated fractions of proteins
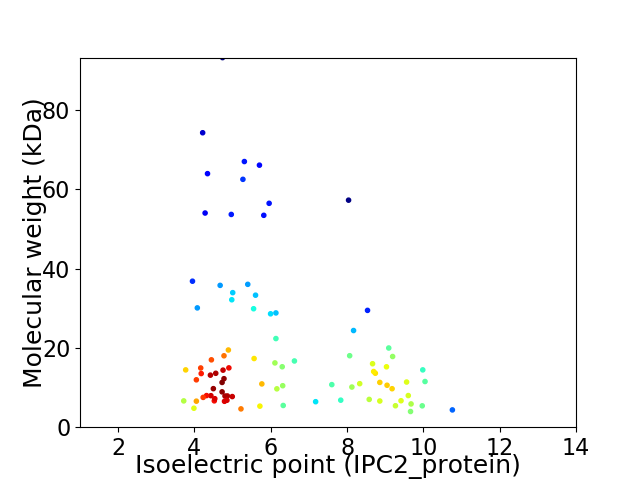
Virtual 2D-PAGE plot for 89 proteins (isoelectric point calculated using IPC2_protein)
Get csv file with sequences according to given criteria:
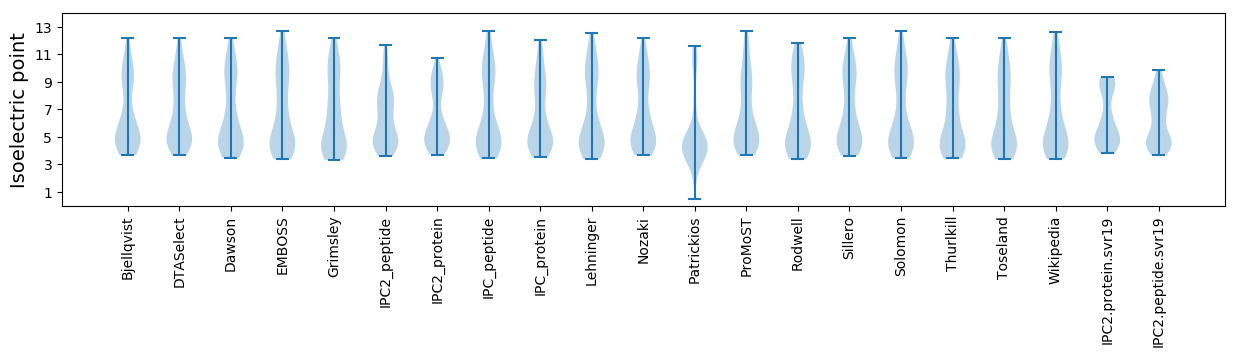
* You can choose from 21 different methods for calculating isoelectric point
Summary statistics related to proteome-wise predictions
Protein with the lowest isoelectric point:
>tr|A0A3G8FVT3|A0A3G8FVT3_9CAUD Uncharacterized protein OS=Mycobacterium phage Bones OX=2488963 GN=83 PE=4 SV=1
MM1 pKa = 7.06YY2 pKa = 10.59VVTDD6 pKa = 4.24PDD8 pKa = 3.65GDD10 pKa = 4.04EE11 pKa = 4.22YY12 pKa = 11.25TVTDD16 pKa = 3.96TEE18 pKa = 5.99FEE20 pKa = 4.65DD21 pKa = 3.12GWYY24 pKa = 9.34WVVSPLSEE32 pKa = 4.67FAPCHH37 pKa = 6.69LDD39 pKa = 3.74LGLHH43 pKa = 4.69RR44 pKa = 11.84TKK46 pKa = 10.64RR47 pKa = 11.84DD48 pKa = 3.07AVAALAEE55 pKa = 4.56FVSS58 pKa = 4.03
MM1 pKa = 7.06YY2 pKa = 10.59VVTDD6 pKa = 4.24PDD8 pKa = 3.65GDD10 pKa = 4.04EE11 pKa = 4.22YY12 pKa = 11.25TVTDD16 pKa = 3.96TEE18 pKa = 5.99FEE20 pKa = 4.65DD21 pKa = 3.12GWYY24 pKa = 9.34WVVSPLSEE32 pKa = 4.67FAPCHH37 pKa = 6.69LDD39 pKa = 3.74LGLHH43 pKa = 4.69RR44 pKa = 11.84TKK46 pKa = 10.64RR47 pKa = 11.84DD48 pKa = 3.07AVAALAEE55 pKa = 4.56FVSS58 pKa = 4.03
Molecular weight: 6.57 kDa
Isoelectric point according different methods:
Protein with the highest isoelectric point:
>tr|A0A3G8FVP3|A0A3G8FVP3_9CAUD Portal protein OS=Mycobacterium phage Bones OX=2488963 GN=12 PE=4 SV=1
MM1 pKa = 7.2SRR3 pKa = 11.84IVLRR7 pKa = 11.84SYY9 pKa = 11.36VKK11 pKa = 9.07ITEE14 pKa = 4.03VSTGCKK20 pKa = 9.8FNDD23 pKa = 3.73WEE25 pKa = 4.25WVYY28 pKa = 10.83RR29 pKa = 11.84PWMPLWFQKK38 pKa = 10.4QLIVRR43 pKa = 11.84PLWKK47 pKa = 9.5RR48 pKa = 11.84HH49 pKa = 4.42KK50 pKa = 9.68RR51 pKa = 11.84NCIRR55 pKa = 11.84AEE57 pKa = 3.64HH58 pKa = 5.88WRR60 pKa = 11.84AMDD63 pKa = 3.45
MM1 pKa = 7.2SRR3 pKa = 11.84IVLRR7 pKa = 11.84SYY9 pKa = 11.36VKK11 pKa = 9.07ITEE14 pKa = 4.03VSTGCKK20 pKa = 9.8FNDD23 pKa = 3.73WEE25 pKa = 4.25WVYY28 pKa = 10.83RR29 pKa = 11.84PWMPLWFQKK38 pKa = 10.4QLIVRR43 pKa = 11.84PLWKK47 pKa = 9.5RR48 pKa = 11.84HH49 pKa = 4.42KK50 pKa = 9.68RR51 pKa = 11.84NCIRR55 pKa = 11.84AEE57 pKa = 3.64HH58 pKa = 5.88WRR60 pKa = 11.84AMDD63 pKa = 3.45
Molecular weight: 7.98 kDa
Isoelectric point according different methods:
Peptides (in silico digests for buttom-up proteomics)
Below you can find in silico digests of the whole proteome with Trypsin, Chymotrypsin, Trypsin+LysC, LysN, ArgC proteases suitable for different mass spec machines.| Try ESI |
 |
|---|
| ChTry ESI |
|
|---|
| ArgC ESI |
|
|---|
| LysN ESI |
|
|---|
| TryLysC ESI |
|
|---|
| Try MALDI |
|
|---|
| ChTry MALDI |
|
|---|
| ArgC MALDI |
|
|---|
| LysN MALDI |
|
|---|
| TryLysC MALDI |
|
|---|
| Try LTQ |
|
|---|
| ChTry LTQ |
|
|---|
| ArgC LTQ |
|
|---|
| LysN LTQ |
|
|---|
| TryLysC LTQ |
|
|---|
| Try MSlow |
|
|---|
| ChTry MSlow |
|
|---|
| ArgC MSlow |
|
|---|
| LysN MSlow |
|
|---|
| TryLysC MSlow |
|
|---|
| Try MShigh |
|
|---|
| ChTry MShigh |
|
|---|
| ArgC MShigh |
|
|---|
| LysN MShigh |
|
|---|
| TryLysC MShigh |
|
|---|
General Statistics
Number of major isoforms |
Number of additional isoforms |
Number of all proteins |
Number of amino acids |
Min. Seq. Length |
Max. Seq. Length |
Avg. Seq. Length |
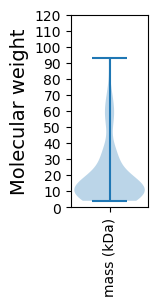
Avg. Mol. Weight |
|---|---|---|---|---|---|---|---|
0 |
16379 |
31 |
886 |
184.0 |
20.19 |
Amino acid frequency
Ala |
Cys |
Asp |
Glu |
Phe |
Gly |
His |
Ile |
Lys |
Leu |
|---|---|---|---|---|---|---|---|---|---|
9.995 ± 0.395 | 0.672 ± 0.123 |
6.698 ± 0.197 | 6.453 ± 0.299 |
3.236 ± 0.147 | 8.664 ± 0.524 |
1.899 ± 0.166 | 4.811 ± 0.206 |
4.304 ± 0.245 | 8.486 ± 0.243 |
Met |
Asn |
Gln |
Pro |
Arg |
Ser |
Thr |
Val |
Trp |
Tyr |
|---|---|---|---|---|---|---|---|---|---|
1.996 ± 0.11 | 3.279 ± 0.156 |
5.617 ± 0.218 | 3.291 ± 0.193 |
6.27 ± 0.432 | 5.879 ± 0.239 |
6.24 ± 0.294 | 7.388 ± 0.255 |
1.942 ± 0.126 | 2.882 ± 0.169 |
Most of the basic statistics you can see at this page can be downloaded from this CSV file
See this proteome in:

Proteome-pI is available under Creative Commons Attribution-NoDerivs license, for more details see here
| Reference: Kozlowski LP. Proteome-pI 2.0: Proteome Isoelectric Point Database Update. Nucleic Acids Res. 2021, doi: 10.1093/nar/gkab944 | Contact: Lukasz P. Kozlowski |