Buchnera aphidicola (Stegophylla sp.)
Taxonomy: cellular organisms; Bacteria; Proteobacteria; Gammaproteobacteria; Enterobacterales; Erwiniaceae; Buchnera; Buchnera aphidicola
Average proteome isoelectric point is 8.58
Get precalculated fractions of proteins
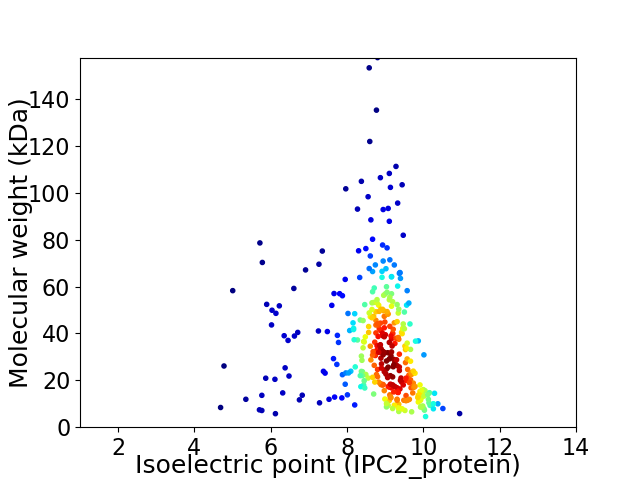
Virtual 2D-PAGE plot for 354 proteins (isoelectric point calculated using IPC2_protein)
Get csv file with sequences according to given criteria:
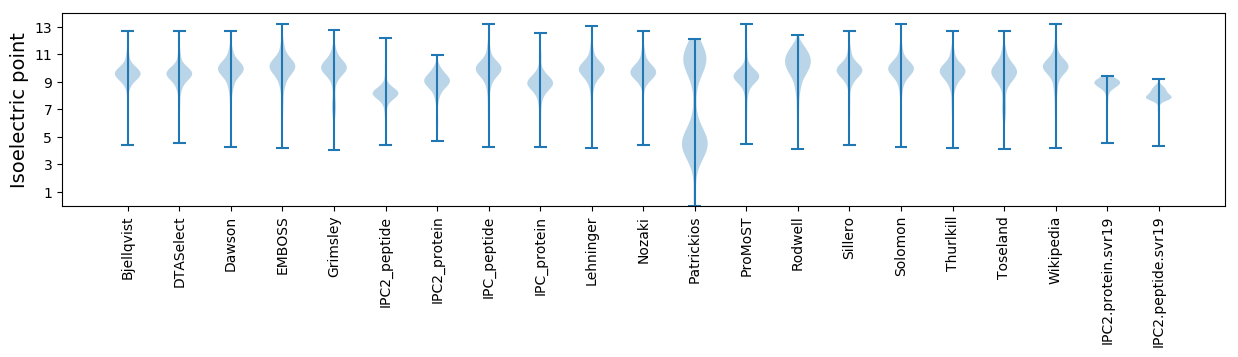
* You can choose from 21 different methods for calculating isoelectric point
Summary statistics related to proteome-wise predictions
Protein with the lowest isoelectric point:
>tr|A0A4D6Y992|A0A4D6Y992_9GAMM HPr family phosphocarrier protein OS=Buchnera aphidicola (Stegophylla sp.) OX=2315800 GN=D9V79_00245 PE=4 SV=1
MM1 pKa = 7.59EE2 pKa = 6.14SINTDD7 pKa = 2.66ILYY10 pKa = 9.88FAASIMIGLAAIGASIGIGILGGKK34 pKa = 8.69FLEE37 pKa = 5.36GAARR41 pKa = 11.84QPDD44 pKa = 5.18LIPILRR50 pKa = 11.84TQFFIVMGLVDD61 pKa = 7.0AIPMIAVGLSLYY73 pKa = 10.33IIFSFSGG80 pKa = 3.05
MM1 pKa = 7.59EE2 pKa = 6.14SINTDD7 pKa = 2.66ILYY10 pKa = 9.88FAASIMIGLAAIGASIGIGILGGKK34 pKa = 8.69FLEE37 pKa = 5.36GAARR41 pKa = 11.84QPDD44 pKa = 5.18LIPILRR50 pKa = 11.84TQFFIVMGLVDD61 pKa = 7.0AIPMIAVGLSLYY73 pKa = 10.33IIFSFSGG80 pKa = 3.05
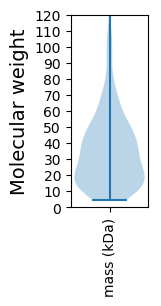
Molecular weight: 8.41 kDa
Isoelectric point according different methods:
Protein with the highest isoelectric point:
>tr|A0A4D6Y8P8|A0A4D6Y8P8_9GAMM Dihydrolipoyl dehydrogenase OS=Buchnera aphidicola (Stegophylla sp.) OX=2315800 GN=lpdA PE=3 SV=1
MM1 pKa = 7.45KK2 pKa = 9.56RR3 pKa = 11.84TFQPSRR9 pKa = 11.84LKK11 pKa = 10.51RR12 pKa = 11.84NRR14 pKa = 11.84VHH16 pKa = 7.35GFRR19 pKa = 11.84IRR21 pKa = 11.84MKK23 pKa = 9.28TKK25 pKa = 9.53NGRR28 pKa = 11.84HH29 pKa = 4.84ILSRR33 pKa = 11.84RR34 pKa = 11.84RR35 pKa = 11.84KK36 pKa = 9.06KK37 pKa = 10.53LRR39 pKa = 11.84TRR41 pKa = 11.84LTVSSEE47 pKa = 3.72
MM1 pKa = 7.45KK2 pKa = 9.56RR3 pKa = 11.84TFQPSRR9 pKa = 11.84LKK11 pKa = 10.51RR12 pKa = 11.84NRR14 pKa = 11.84VHH16 pKa = 7.35GFRR19 pKa = 11.84IRR21 pKa = 11.84MKK23 pKa = 9.28TKK25 pKa = 9.53NGRR28 pKa = 11.84HH29 pKa = 4.84ILSRR33 pKa = 11.84RR34 pKa = 11.84RR35 pKa = 11.84KK36 pKa = 9.06KK37 pKa = 10.53LRR39 pKa = 11.84TRR41 pKa = 11.84LTVSSEE47 pKa = 3.72
Molecular weight: 5.82 kDa
Isoelectric point according different methods:
Peptides (in silico digests for buttom-up proteomics)
Below you can find in silico digests of the whole proteome with Trypsin, Chymotrypsin, Trypsin+LysC, LysN, ArgC proteases suitable for different mass spec machines.| Try ESI |
 |
|---|
| ChTry ESI |
|
|---|
| ArgC ESI |
|
|---|
| LysN ESI |
|
|---|
| TryLysC ESI |
|
|---|
| Try MALDI |
|
|---|
| ChTry MALDI |
|
|---|
| ArgC MALDI |
|
|---|
| LysN MALDI |
|
|---|
| TryLysC MALDI |
|
|---|
| Try LTQ |
|
|---|
| ChTry LTQ |
|
|---|
| ArgC LTQ |
|
|---|
| LysN LTQ |
|
|---|
| TryLysC LTQ |
|
|---|
| Try MSlow |
|
|---|
| ChTry MSlow |
|
|---|
| ArgC MSlow |
|
|---|
| LysN MSlow |
|
|---|
| TryLysC MSlow |
|
|---|
| Try MShigh |
|
|---|
| ChTry MShigh |
|
|---|
| ArgC MShigh |
|
|---|
| LysN MShigh |
|
|---|
| TryLysC MShigh |
|
|---|
General Statistics
Number of major isoforms |
Number of additional isoforms |
Number of all proteins |
Number of amino acids |
Min. Seq. Length |
Max. Seq. Length |
Avg. Seq. Length |
Avg. Mol. Weight |
|---|---|---|---|---|---|---|---|
0 |
112165 |
38 |
1394 |
316.9 |
36.53 |
Amino acid frequency
Ala |
Cys |
Asp |
Glu |
Phe |
Gly |
His |
Ile |
Lys |
Leu |
|---|---|---|---|---|---|---|---|---|---|
3.525 ± 0.102 | 1.422 ± 0.047 |
3.938 ± 0.08 | 4.09 ± 0.116 |
4.863 ± 0.122 | 5.245 ± 0.096 |
2.614 ± 0.058 | 13.15 ± 0.151 |
9.912 ± 0.15 | 9.512 ± 0.132 |
Met |
Asn |
Gln |
Pro |
Arg |
Ser |
Thr |
Val |
Trp |
Tyr |
|---|---|---|---|---|---|---|---|---|---|
2.397 ± 0.055 | 7.733 ± 0.115 |
2.932 ± 0.055 | 3.97 ± 0.076 |
3.482 ± 0.093 | 6.61 ± 0.095 |
4.61 ± 0.09 | 4.557 ± 0.112 |
0.908 ± 0.054 | 4.527 ± 0.096 |
Most of the basic statistics you can see at this page can be downloaded from this CSV file
See this proteome in:

Proteome-pI is available under Creative Commons Attribution-NoDerivs license, for more details see here
| Reference: Kozlowski LP. Proteome-pI 2.0: Proteome Isoelectric Point Database Update. Nucleic Acids Res. 2021, doi: 10.1093/nar/gkab944 | Contact: Lukasz P. Kozlowski |