Dermatophilus congolensis
Taxonomy: cellular organisms; Bacteria; Terrabacteria group; Actinobacteria; Actinomycetia; Micrococcales; Dermatophilaceae; Dermatophilus
Average proteome isoelectric point is 6.42
Get precalculated fractions of proteins
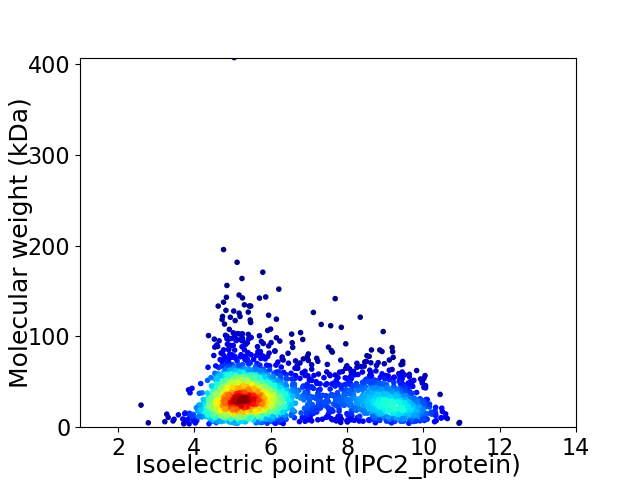
Virtual 2D-PAGE plot for 2311 proteins (isoelectric point calculated using IPC2_protein)
Get csv file with sequences according to given criteria:
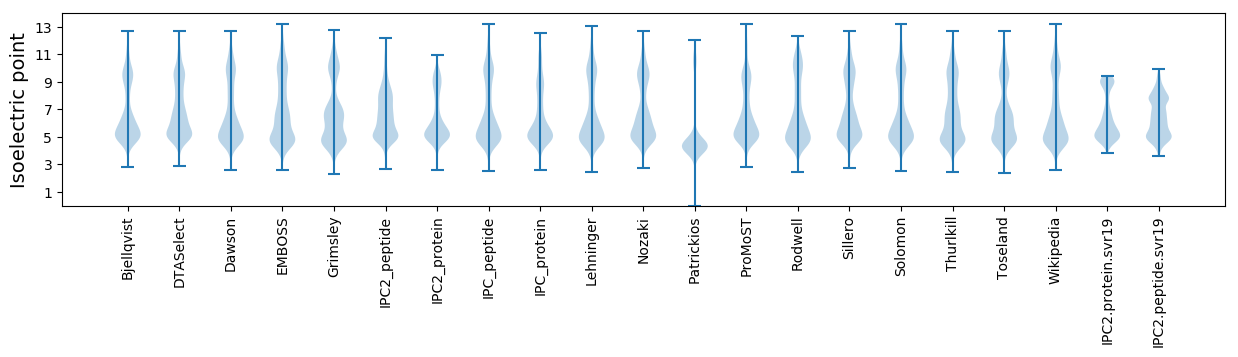
* You can choose from 21 different methods for calculating isoelectric point
Summary statistics related to proteome-wise predictions
Protein with the lowest isoelectric point:
>tr|A0A239VKI9|A0A239VKI9_9MICO Ribosomal protein S12 methylthiotransferase RimO OS=Dermatophilus congolensis OX=1863 GN=rimO PE=3 SV=1
MM1 pKa = 7.73RR2 pKa = 11.84EE3 pKa = 3.74WKK5 pKa = 10.34QILGALWRR13 pKa = 11.84VYY15 pKa = 9.04WGCCGDD21 pKa = 4.81LLALEE26 pKa = 5.32DD27 pKa = 4.97DD28 pKa = 4.25YY29 pKa = 12.11APGVDD34 pKa = 3.91EE35 pKa = 4.74GAVFADD41 pKa = 3.71AA42 pKa = 5.34
MM1 pKa = 7.73RR2 pKa = 11.84EE3 pKa = 3.74WKK5 pKa = 10.34QILGALWRR13 pKa = 11.84VYY15 pKa = 9.04WGCCGDD21 pKa = 4.81LLALEE26 pKa = 5.32DD27 pKa = 4.97DD28 pKa = 4.25YY29 pKa = 12.11APGVDD34 pKa = 3.91EE35 pKa = 4.74GAVFADD41 pKa = 3.71AA42 pKa = 5.34
Molecular weight: 4.7 kDa
Isoelectric point according different methods:
Protein with the highest isoelectric point:
>tr|A0A239VA44|A0A239VA44_9MICO Proline-specific permease ProY OS=Dermatophilus congolensis OX=1863 GN=proY PE=3 SV=1
MM1 pKa = 7.69SKK3 pKa = 9.0RR4 pKa = 11.84TFQPNNRR11 pKa = 11.84RR12 pKa = 11.84RR13 pKa = 11.84AKK15 pKa = 9.8KK16 pKa = 9.13HH17 pKa = 4.41GFRR20 pKa = 11.84SRR22 pKa = 11.84MATRR26 pKa = 11.84AGRR29 pKa = 11.84AILACRR35 pKa = 11.84RR36 pKa = 11.84RR37 pKa = 11.84KK38 pKa = 9.88GRR40 pKa = 11.84ASISAA45 pKa = 3.59
MM1 pKa = 7.69SKK3 pKa = 9.0RR4 pKa = 11.84TFQPNNRR11 pKa = 11.84RR12 pKa = 11.84RR13 pKa = 11.84AKK15 pKa = 9.8KK16 pKa = 9.13HH17 pKa = 4.41GFRR20 pKa = 11.84SRR22 pKa = 11.84MATRR26 pKa = 11.84AGRR29 pKa = 11.84AILACRR35 pKa = 11.84RR36 pKa = 11.84RR37 pKa = 11.84KK38 pKa = 9.88GRR40 pKa = 11.84ASISAA45 pKa = 3.59
Molecular weight: 5.21 kDa
Isoelectric point according different methods:
Peptides (in silico digests for buttom-up proteomics)
Below you can find in silico digests of the whole proteome with Trypsin, Chymotrypsin, Trypsin+LysC, LysN, ArgC proteases suitable for different mass spec machines.| Try ESI |
 |
|---|
| ChTry ESI |
|
|---|
| ArgC ESI |
|
|---|
| LysN ESI |
|
|---|
| TryLysC ESI |
|
|---|
| Try MALDI |
|
|---|
| ChTry MALDI |
|
|---|
| ArgC MALDI |
|
|---|
| LysN MALDI |
|
|---|
| TryLysC MALDI |
|
|---|
| Try LTQ |
|
|---|
| ChTry LTQ |
|
|---|
| ArgC LTQ |
|
|---|
| LysN LTQ |
|
|---|
| TryLysC LTQ |
|
|---|
| Try MSlow |
|
|---|
| ChTry MSlow |
|
|---|
| ArgC MSlow |
|
|---|
| LysN MSlow |
|
|---|
| TryLysC MSlow |
|
|---|
| Try MShigh |
|
|---|
| ChTry MShigh |
|
|---|
| ArgC MShigh |
|
|---|
| LysN MShigh |
|
|---|
| TryLysC MShigh |
|
|---|
General Statistics
Number of major isoforms |
Number of additional isoforms |
Number of all proteins |
Number of amino acids |
Min. Seq. Length |
Max. Seq. Length |
Avg. Seq. Length |
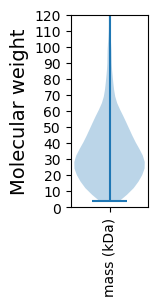
Avg. Mol. Weight |
|---|---|---|---|---|---|---|---|
0 |
781931 |
33 |
3782 |
338.4 |
36.43 |
Amino acid frequency
Ala |
Cys |
Asp |
Glu |
Phe |
Gly |
His |
Ile |
Lys |
Leu |
|---|---|---|---|---|---|---|---|---|---|
12.114 ± 0.063 | 0.829 ± 0.016 |
5.499 ± 0.039 | 5.553 ± 0.057 |
2.91 ± 0.033 | 8.505 ± 0.058 |
2.639 ± 0.035 | 4.851 ± 0.047 |
2.664 ± 0.038 | 9.615 ± 0.053 |
Met |
Asn |
Gln |
Pro |
Arg |
Ser |
Thr |
Val |
Trp |
Tyr |
|---|---|---|---|---|---|---|---|---|---|
2.112 ± 0.021 | 2.721 ± 0.034 |
5.533 ± 0.043 | 3.114 ± 0.026 |
6.774 ± 0.05 | 5.728 ± 0.045 |
7.06 ± 0.081 | 8.392 ± 0.077 |
1.43 ± 0.024 | 1.956 ± 0.024 |
Most of the basic statistics you can see at this page can be downloaded from this CSV file
See this proteome in:

Proteome-pI is available under Creative Commons Attribution-NoDerivs license, for more details see here
| Reference: Kozlowski LP. Proteome-pI 2.0: Proteome Isoelectric Point Database Update. Nucleic Acids Res. 2021, doi: 10.1093/nar/gkab944 | Contact: Lukasz P. Kozlowski |