Salmonella phage 7-11
Taxonomy: Viruses; Duplodnaviria; Heunggongvirae; Uroviricota; Caudoviricetes; Caudovirales; Podoviridae; unclassified Podoviridae
Average proteome isoelectric point is 6.61
Get precalculated fractions of proteins
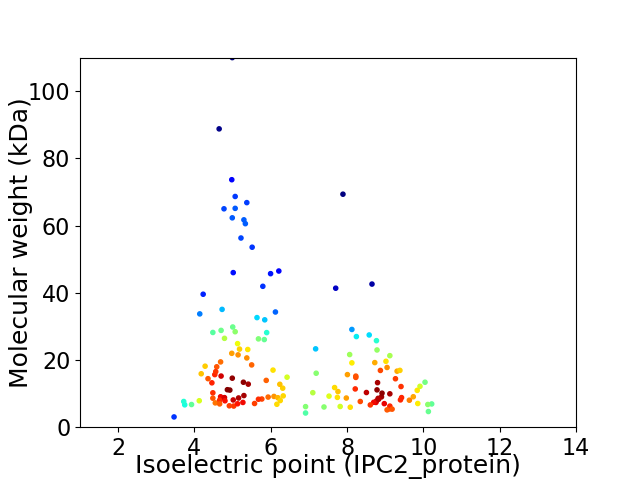
Virtual 2D-PAGE plot for 151 proteins (isoelectric point calculated using IPC2_protein)
Get csv file with sequences according to given criteria:
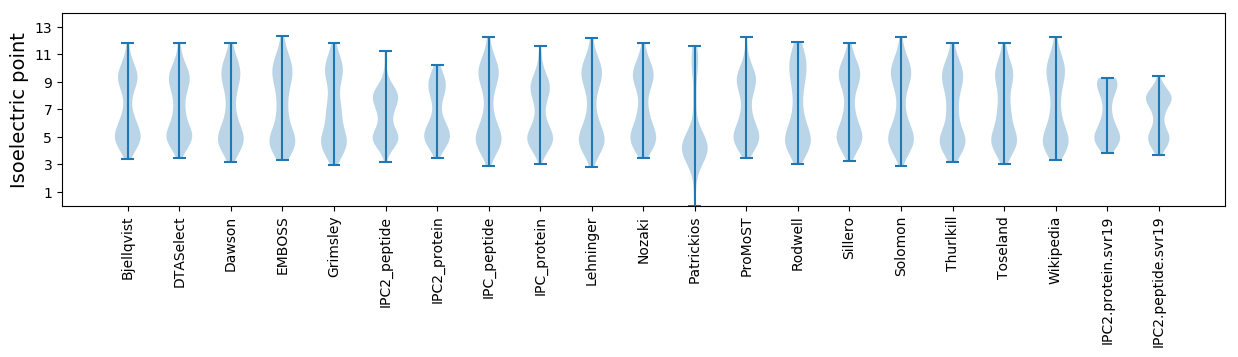
* You can choose from 21 different methods for calculating isoelectric point
Summary statistics related to proteome-wise predictions
Protein with the lowest isoelectric point:
>tr|G0X509|G0X509_9CAUD Uncharacterized protein OS=Salmonella phage 7-11 OX=1054968 PE=4 SV=1
MM1 pKa = 7.63KK2 pKa = 10.5VGLLIANGGDD12 pKa = 3.51GSASIHH18 pKa = 5.42YY19 pKa = 9.81FKK21 pKa = 11.19DD22 pKa = 3.69LIYY25 pKa = 10.78ASQLQDD31 pKa = 3.77CDD33 pKa = 3.87THH35 pKa = 8.74CEE37 pKa = 4.12TFGLNDD43 pKa = 3.48SMDD46 pKa = 4.14IIDD49 pKa = 4.2VPEE52 pKa = 4.26GFYY55 pKa = 10.79PPGGFSDD62 pKa = 4.38YY63 pKa = 11.16EE64 pKa = 3.95WDD66 pKa = 4.16LEE68 pKa = 4.34EE69 pKa = 4.59
MM1 pKa = 7.63KK2 pKa = 10.5VGLLIANGGDD12 pKa = 3.51GSASIHH18 pKa = 5.42YY19 pKa = 9.81FKK21 pKa = 11.19DD22 pKa = 3.69LIYY25 pKa = 10.78ASQLQDD31 pKa = 3.77CDD33 pKa = 3.87THH35 pKa = 8.74CEE37 pKa = 4.12TFGLNDD43 pKa = 3.48SMDD46 pKa = 4.14IIDD49 pKa = 4.2VPEE52 pKa = 4.26GFYY55 pKa = 10.79PPGGFSDD62 pKa = 4.38YY63 pKa = 11.16EE64 pKa = 3.95WDD66 pKa = 4.16LEE68 pKa = 4.34EE69 pKa = 4.59
Molecular weight: 7.65 kDa
Isoelectric point according different methods:
Protein with the highest isoelectric point:
>tr|G0X578|G0X578_9CAUD Uncharacterized protein OS=Salmonella phage 7-11 OX=1054968 PE=4 SV=1
MM1 pKa = 7.29RR2 pKa = 11.84QSAFQLLKK10 pKa = 11.08ASLDD14 pKa = 3.95NNNGAPVSQVQRR26 pKa = 11.84EE27 pKa = 3.96VLLNKK32 pKa = 9.95KK33 pKa = 9.2VLYY36 pKa = 10.14RR37 pKa = 11.84YY38 pKa = 9.04ARR40 pKa = 11.84PTQQVFGTITAFTGNIQRR58 pKa = 11.84VWVKK62 pKa = 9.53WSDD65 pKa = 3.52GAVEE69 pKa = 3.92ARR71 pKa = 11.84SIKK74 pKa = 10.28SLEE77 pKa = 4.17VIKK80 pKa = 10.97
MM1 pKa = 7.29RR2 pKa = 11.84QSAFQLLKK10 pKa = 11.08ASLDD14 pKa = 3.95NNNGAPVSQVQRR26 pKa = 11.84EE27 pKa = 3.96VLLNKK32 pKa = 9.95KK33 pKa = 9.2VLYY36 pKa = 10.14RR37 pKa = 11.84YY38 pKa = 9.04ARR40 pKa = 11.84PTQQVFGTITAFTGNIQRR58 pKa = 11.84VWVKK62 pKa = 9.53WSDD65 pKa = 3.52GAVEE69 pKa = 3.92ARR71 pKa = 11.84SIKK74 pKa = 10.28SLEE77 pKa = 4.17VIKK80 pKa = 10.97
Molecular weight: 9.06 kDa
Isoelectric point according different methods:
Peptides (in silico digests for buttom-up proteomics)
Below you can find in silico digests of the whole proteome with Trypsin, Chymotrypsin, Trypsin+LysC, LysN, ArgC proteases suitable for different mass spec machines.| Try ESI |
 |
|---|
| ChTry ESI |
|
|---|
| ArgC ESI |
|
|---|
| LysN ESI |
|
|---|
| TryLysC ESI |
|
|---|
| Try MALDI |
|
|---|
| ChTry MALDI |
|
|---|
| ArgC MALDI |
|
|---|
| LysN MALDI |
|
|---|
| TryLysC MALDI |
|
|---|
| Try LTQ |
|
|---|
| ChTry LTQ |
|
|---|
| ArgC LTQ |
|
|---|
| LysN LTQ |
|
|---|
| TryLysC LTQ |
|
|---|
| Try MSlow |
|
|---|
| ChTry MSlow |
|
|---|
| ArgC MSlow |
|
|---|
| LysN MSlow |
|
|---|
| TryLysC MSlow |
|
|---|
| Try MShigh |
|
|---|
| ChTry MShigh |
|
|---|
| ArgC MShigh |
|
|---|
| LysN MShigh |
|
|---|
| TryLysC MShigh |
|
|---|
General Statistics
Number of major isoforms |
Number of additional isoforms |
Number of all proteins |
Number of amino acids |
Min. Seq. Length |
Max. Seq. Length |
Avg. Seq. Length |
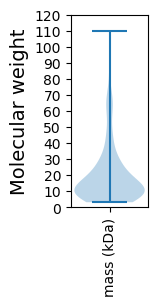
Avg. Mol. Weight |
|---|---|---|---|---|---|---|---|
0 |
26783 |
27 |
976 |
177.4 |
20.0 |
Amino acid frequency
Ala |
Cys |
Asp |
Glu |
Phe |
Gly |
His |
Ile |
Lys |
Leu |
|---|---|---|---|---|---|---|---|---|---|
7.919 ± 0.315 | 1.217 ± 0.102 |
6.239 ± 0.167 | 7.158 ± 0.309 |
4.144 ± 0.197 | 6.963 ± 0.264 |
2.061 ± 0.114 | 5.119 ± 0.156 |
6.624 ± 0.241 | 7.113 ± 0.202 |
Met |
Asn |
Gln |
Pro |
Arg |
Ser |
Thr |
Val |
Trp |
Tyr |
|---|---|---|---|---|---|---|---|---|---|
2.953 ± 0.093 | 5.022 ± 0.149 |
3.696 ± 0.139 | 4.073 ± 0.226 |
5.395 ± 0.209 | 6.138 ± 0.18 |
5.686 ± 0.231 | 7.143 ± 0.194 |
1.729 ± 0.14 | 3.607 ± 0.15 |
Most of the basic statistics you can see at this page can be downloaded from this CSV file
See this proteome in:

Proteome-pI is available under Creative Commons Attribution-NoDerivs license, for more details see here
| Reference: Kozlowski LP. Proteome-pI 2.0: Proteome Isoelectric Point Database Update. Nucleic Acids Res. 2021, doi: 10.1093/nar/gkab944 | Contact: Lukasz P. Kozlowski |