Microbacterium phage Piperis
Taxonomy: Viruses; Duplodnaviria; Heunggongvirae; Uroviricota; Caudoviricetes; Caudovirales; Siphoviridae; Quhwahvirus; unclassified Quhwahvirus
Average proteome isoelectric point is 5.97
Get precalculated fractions of proteins
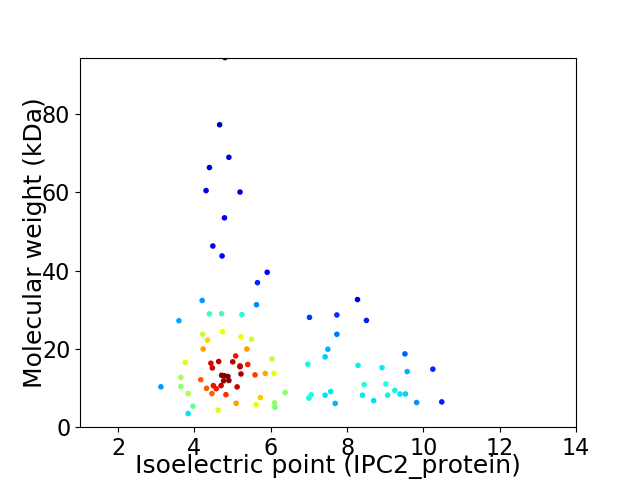
Virtual 2D-PAGE plot for 92 proteins (isoelectric point calculated using IPC2_protein)
Get csv file with sequences according to given criteria:
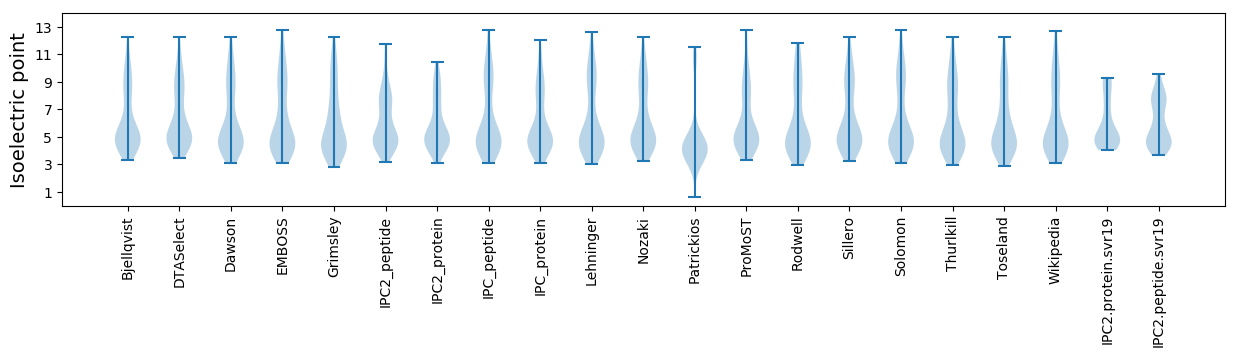
* You can choose from 21 different methods for calculating isoelectric point
Summary statistics related to proteome-wise predictions
Protein with the lowest isoelectric point:
>tr|A0A4Y5P012|A0A4Y5P012_9CAUD Portal protein OS=Microbacterium phage Piperis OX=2584496 GN=20 PE=4 SV=1
MM1 pKa = 7.6AGPYY5 pKa = 9.54KK6 pKa = 10.57VYY8 pKa = 10.52NDD10 pKa = 4.43HH11 pKa = 7.19GDD13 pKa = 4.5LIAGDD18 pKa = 4.34PSLDD22 pKa = 3.92DD23 pKa = 4.34LLKK26 pKa = 10.35ATARR30 pKa = 11.84DD31 pKa = 3.22ASGYY35 pKa = 10.11IEE37 pKa = 5.15DD38 pKa = 4.27ADD40 pKa = 4.16GEE42 pKa = 4.77VVYY45 pKa = 10.89GDD47 pKa = 3.95RR48 pKa = 11.84PAGG51 pKa = 3.52
MM1 pKa = 7.6AGPYY5 pKa = 9.54KK6 pKa = 10.57VYY8 pKa = 10.52NDD10 pKa = 4.43HH11 pKa = 7.19GDD13 pKa = 4.5LIAGDD18 pKa = 4.34PSLDD22 pKa = 3.92DD23 pKa = 4.34LLKK26 pKa = 10.35ATARR30 pKa = 11.84DD31 pKa = 3.22ASGYY35 pKa = 10.11IEE37 pKa = 5.15DD38 pKa = 4.27ADD40 pKa = 4.16GEE42 pKa = 4.77VVYY45 pKa = 10.89GDD47 pKa = 3.95RR48 pKa = 11.84PAGG51 pKa = 3.52
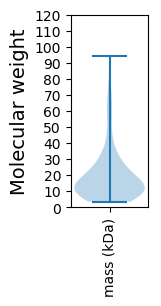
Molecular weight: 5.36 kDa
Isoelectric point according different methods:
Protein with the highest isoelectric point:
>tr|A0A4Y5NZY0|A0A4Y5NZY0_9CAUD Uncharacterized protein OS=Microbacterium phage Piperis OX=2584496 GN=63 PE=4 SV=1
MM1 pKa = 7.62AKK3 pKa = 10.33SIDD6 pKa = 3.74PYY8 pKa = 9.73EE9 pKa = 4.27VKK11 pKa = 10.04TIRR14 pKa = 11.84TGYY17 pKa = 8.13TNRR20 pKa = 11.84KK21 pKa = 6.81VKK23 pKa = 10.62KK24 pKa = 9.81LVRR27 pKa = 11.84QGWEE31 pKa = 3.89VIAQRR36 pKa = 11.84GGVLGSAGEE45 pKa = 4.1VTLRR49 pKa = 11.84RR50 pKa = 11.84LRR52 pKa = 11.84PNSDD56 pKa = 2.72
MM1 pKa = 7.62AKK3 pKa = 10.33SIDD6 pKa = 3.74PYY8 pKa = 9.73EE9 pKa = 4.27VKK11 pKa = 10.04TIRR14 pKa = 11.84TGYY17 pKa = 8.13TNRR20 pKa = 11.84KK21 pKa = 6.81VKK23 pKa = 10.62KK24 pKa = 9.81LVRR27 pKa = 11.84QGWEE31 pKa = 3.89VIAQRR36 pKa = 11.84GGVLGSAGEE45 pKa = 4.1VTLRR49 pKa = 11.84RR50 pKa = 11.84LRR52 pKa = 11.84PNSDD56 pKa = 2.72
Molecular weight: 6.3 kDa
Isoelectric point according different methods:
Peptides (in silico digests for buttom-up proteomics)
Below you can find in silico digests of the whole proteome with Trypsin, Chymotrypsin, Trypsin+LysC, LysN, ArgC proteases suitable for different mass spec machines.| Try ESI |
 |
|---|
| ChTry ESI |
|
|---|
| ArgC ESI |
|
|---|
| LysN ESI |
|
|---|
| TryLysC ESI |
|
|---|
| Try MALDI |
|
|---|
| ChTry MALDI |
|
|---|
| ArgC MALDI |
|
|---|
| LysN MALDI |
|
|---|
| TryLysC MALDI |
|
|---|
| Try LTQ |
|
|---|
| ChTry LTQ |
|
|---|
| ArgC LTQ |
|
|---|
| LysN LTQ |
|
|---|
| TryLysC LTQ |
|
|---|
| Try MSlow |
|
|---|
| ChTry MSlow |
|
|---|
| ArgC MSlow |
|
|---|
| LysN MSlow |
|
|---|
| TryLysC MSlow |
|
|---|
| Try MShigh |
|
|---|
| ChTry MShigh |
|
|---|
| ArgC MShigh |
|
|---|
| LysN MShigh |
|
|---|
| TryLysC MShigh |
|
|---|
General Statistics
Number of major isoforms |
Number of additional isoforms |
Number of all proteins |
Number of amino acids |
Min. Seq. Length |
Max. Seq. Length |
Avg. Seq. Length |
Avg. Mol. Weight |
|---|---|---|---|---|---|---|---|
0 |
16920 |
30 |
955 |
183.9 |
19.92 |
Amino acid frequency
Ala |
Cys |
Asp |
Glu |
Phe |
Gly |
His |
Ile |
Lys |
Leu |
|---|---|---|---|---|---|---|---|---|---|
12.199 ± 0.408 | 0.892 ± 0.13 |
6.826 ± 0.394 | 6.436 ± 0.334 |
2.553 ± 0.133 | 8.605 ± 0.331 |
1.95 ± 0.185 | 4.468 ± 0.258 |
2.559 ± 0.162 | 7.512 ± 0.394 |
Met |
Asn |
Gln |
Pro |
Arg |
Ser |
Thr |
Val |
Trp |
Tyr |
|---|---|---|---|---|---|---|---|---|---|
2.465 ± 0.122 | 2.547 ± 0.15 |
6.07 ± 0.329 | 3.132 ± 0.152 |
7.051 ± 0.381 | 5.792 ± 0.278 |
7.045 ± 0.277 | 7.447 ± 0.23 |
1.874 ± 0.17 | 2.577 ± 0.213 |
Most of the basic statistics you can see at this page can be downloaded from this CSV file
See this proteome in:

Proteome-pI is available under Creative Commons Attribution-NoDerivs license, for more details see here
| Reference: Kozlowski LP. Proteome-pI 2.0: Proteome Isoelectric Point Database Update. Nucleic Acids Res. 2021, doi: 10.1093/nar/gkab944 | Contact: Lukasz P. Kozlowski |