Ekpoma virus 2
Taxonomy: Viruses; Riboviria; Orthornavirae; Negarnaviricota; Haploviricotina; Monjiviricetes; Mononegavirales; Rhabdoviridae; Alpharhabdovirinae; Tibrovirus; Ekpoma 2 tibrovirus
Average proteome isoelectric point is 7.28
Get precalculated fractions of proteins
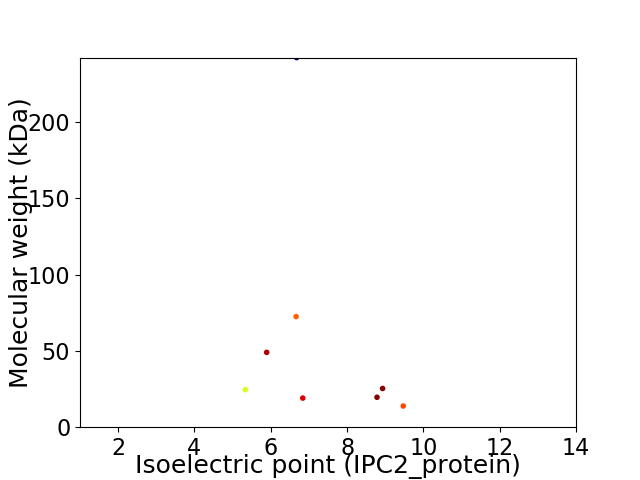
Virtual 2D-PAGE plot for 8 proteins (isoelectric point calculated using IPC2_protein)
Get csv file with sequences according to given criteria:
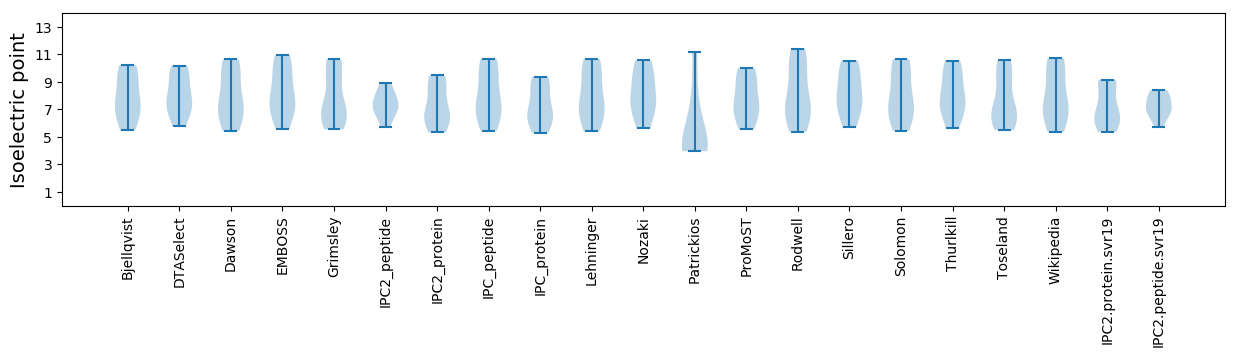
* You can choose from 21 different methods for calculating isoelectric point
Summary statistics related to proteome-wise predictions
Protein with the lowest isoelectric point:
>tr|A0A0C5BZR0|A0A0C5BZR0_9RHAB U3 protein OS=Ekpoma virus 2 OX=1987021 PE=4 SV=1
MM1 pKa = 7.53NKK3 pKa = 9.55PDD5 pKa = 4.53FSKK8 pKa = 10.88LYY10 pKa = 10.47QNYY13 pKa = 10.34SMEE16 pKa = 4.25KK17 pKa = 10.26LRR19 pKa = 11.84DD20 pKa = 3.61SLRR23 pKa = 11.84DD24 pKa = 3.32MALQPNDD31 pKa = 4.35EE32 pKa = 4.31VPEE35 pKa = 4.33DD36 pKa = 4.84PIHH39 pKa = 6.56NNPSTSTGYY48 pKa = 8.61TNKK51 pKa = 10.08NPLEE55 pKa = 4.22SSKK58 pKa = 9.89LTPSYY63 pKa = 10.81DD64 pKa = 3.37WEE66 pKa = 4.48SSISPDD72 pKa = 3.39TSLTQQSKK80 pKa = 10.8LDD82 pKa = 4.36PIKK85 pKa = 10.48EE86 pKa = 4.23VFPMASLSDD95 pKa = 3.55ILRR98 pKa = 11.84ALALFNIHH106 pKa = 6.29EE107 pKa = 4.44SMDD110 pKa = 3.67FEE112 pKa = 4.58ISCEE116 pKa = 3.84KK117 pKa = 10.06LTFSIFPINRR127 pKa = 11.84SVTQNISSTPEE138 pKa = 3.49HH139 pKa = 6.59GKK141 pKa = 8.31TYY143 pKa = 7.13PTLRR147 pKa = 11.84EE148 pKa = 3.79VLEE151 pKa = 4.28RR152 pKa = 11.84GIIVHH157 pKa = 6.97KK158 pKa = 9.67LPSMKK163 pKa = 9.98PVTIHH168 pKa = 6.55AWTKK172 pKa = 10.52GINLEE177 pKa = 4.69KK178 pKa = 10.04IDD180 pKa = 4.32DD181 pKa = 3.99LMYY184 pKa = 10.91ADD186 pKa = 5.83DD187 pKa = 5.07MDD189 pKa = 5.21DD190 pKa = 3.79VEE192 pKa = 5.98CIAKK196 pKa = 9.15TIIKK200 pKa = 10.13ASRR203 pKa = 11.84LTRR206 pKa = 11.84SLTHH210 pKa = 6.76EE211 pKa = 4.5GAKK214 pKa = 10.14HH215 pKa = 5.42CAA217 pKa = 3.33
MM1 pKa = 7.53NKK3 pKa = 9.55PDD5 pKa = 4.53FSKK8 pKa = 10.88LYY10 pKa = 10.47QNYY13 pKa = 10.34SMEE16 pKa = 4.25KK17 pKa = 10.26LRR19 pKa = 11.84DD20 pKa = 3.61SLRR23 pKa = 11.84DD24 pKa = 3.32MALQPNDD31 pKa = 4.35EE32 pKa = 4.31VPEE35 pKa = 4.33DD36 pKa = 4.84PIHH39 pKa = 6.56NNPSTSTGYY48 pKa = 8.61TNKK51 pKa = 10.08NPLEE55 pKa = 4.22SSKK58 pKa = 9.89LTPSYY63 pKa = 10.81DD64 pKa = 3.37WEE66 pKa = 4.48SSISPDD72 pKa = 3.39TSLTQQSKK80 pKa = 10.8LDD82 pKa = 4.36PIKK85 pKa = 10.48EE86 pKa = 4.23VFPMASLSDD95 pKa = 3.55ILRR98 pKa = 11.84ALALFNIHH106 pKa = 6.29EE107 pKa = 4.44SMDD110 pKa = 3.67FEE112 pKa = 4.58ISCEE116 pKa = 3.84KK117 pKa = 10.06LTFSIFPINRR127 pKa = 11.84SVTQNISSTPEE138 pKa = 3.49HH139 pKa = 6.59GKK141 pKa = 8.31TYY143 pKa = 7.13PTLRR147 pKa = 11.84EE148 pKa = 3.79VLEE151 pKa = 4.28RR152 pKa = 11.84GIIVHH157 pKa = 6.97KK158 pKa = 9.67LPSMKK163 pKa = 9.98PVTIHH168 pKa = 6.55AWTKK172 pKa = 10.52GINLEE177 pKa = 4.69KK178 pKa = 10.04IDD180 pKa = 4.32DD181 pKa = 3.99LMYY184 pKa = 10.91ADD186 pKa = 5.83DD187 pKa = 5.07MDD189 pKa = 5.21DD190 pKa = 3.79VEE192 pKa = 5.98CIAKK196 pKa = 9.15TIIKK200 pKa = 10.13ASRR203 pKa = 11.84LTRR206 pKa = 11.84SLTHH210 pKa = 6.76EE211 pKa = 4.5GAKK214 pKa = 10.14HH215 pKa = 5.42CAA217 pKa = 3.33
Molecular weight: 24.59 kDa
Isoelectric point according different methods:
Protein with the highest isoelectric point:
>tr|A0A0C5C384|A0A0C5C384_9RHAB Nucleocapsid protein OS=Ekpoma virus 2 OX=1987021 PE=4 SV=1
MM1 pKa = 7.63KK2 pKa = 9.21KK3 pKa = 6.78TTEE6 pKa = 3.82NMGNSLSSHH15 pKa = 5.58LEE17 pKa = 3.81KK18 pKa = 10.93FKK20 pKa = 9.12TTIIWVIGGIGVCIVGCLLIKK41 pKa = 9.82CTSCLHH47 pKa = 7.45DD48 pKa = 5.86IILCCASSKK57 pKa = 9.93TSSPANKK64 pKa = 9.5QMPTIYY70 pKa = 10.37QKK72 pKa = 10.75FKK74 pKa = 8.89KK75 pKa = 9.72QRR77 pKa = 11.84RR78 pKa = 11.84KK79 pKa = 10.4KK80 pKa = 9.21MKK82 pKa = 10.63NKK84 pKa = 7.54ITKK87 pKa = 9.99LARR90 pKa = 11.84TKK92 pKa = 10.52AANKK96 pKa = 9.24TSLKK100 pKa = 10.05RR101 pKa = 11.84IKK103 pKa = 10.29PSTRR107 pKa = 11.84SSLPDD112 pKa = 3.24KK113 pKa = 10.8RR114 pKa = 11.84VGEE117 pKa = 4.39LIGKK121 pKa = 9.23YY122 pKa = 8.65EE123 pKa = 4.06AGG125 pKa = 3.53
MM1 pKa = 7.63KK2 pKa = 9.21KK3 pKa = 6.78TTEE6 pKa = 3.82NMGNSLSSHH15 pKa = 5.58LEE17 pKa = 3.81KK18 pKa = 10.93FKK20 pKa = 9.12TTIIWVIGGIGVCIVGCLLIKK41 pKa = 9.82CTSCLHH47 pKa = 7.45DD48 pKa = 5.86IILCCASSKK57 pKa = 9.93TSSPANKK64 pKa = 9.5QMPTIYY70 pKa = 10.37QKK72 pKa = 10.75FKK74 pKa = 8.89KK75 pKa = 9.72QRR77 pKa = 11.84RR78 pKa = 11.84KK79 pKa = 10.4KK80 pKa = 9.21MKK82 pKa = 10.63NKK84 pKa = 7.54ITKK87 pKa = 9.99LARR90 pKa = 11.84TKK92 pKa = 10.52AANKK96 pKa = 9.24TSLKK100 pKa = 10.05RR101 pKa = 11.84IKK103 pKa = 10.29PSTRR107 pKa = 11.84SSLPDD112 pKa = 3.24KK113 pKa = 10.8RR114 pKa = 11.84VGEE117 pKa = 4.39LIGKK121 pKa = 9.23YY122 pKa = 8.65EE123 pKa = 4.06AGG125 pKa = 3.53
Molecular weight: 13.89 kDa
Isoelectric point according different methods:
Peptides (in silico digests for buttom-up proteomics)
Below you can find in silico digests of the whole proteome with Trypsin, Chymotrypsin, Trypsin+LysC, LysN, ArgC proteases suitable for different mass spec machines.| Try ESI |
 |
|---|
| ChTry ESI |
|
|---|
| ArgC ESI |
|
|---|
| LysN ESI |
|
|---|
| TryLysC ESI |
|
|---|
| Try MALDI |
|
|---|
| ChTry MALDI |
|
|---|
| ArgC MALDI |
|
|---|
| LysN MALDI |
|
|---|
| TryLysC MALDI |
|
|---|
| Try LTQ |
|
|---|
| ChTry LTQ |
|
|---|
| ArgC LTQ |
|
|---|
| LysN LTQ |
|
|---|
| TryLysC LTQ |
|
|---|
| Try MSlow |
|
|---|
| ChTry MSlow |
|
|---|
| ArgC MSlow |
|
|---|
| LysN MSlow |
|
|---|
| TryLysC MSlow |
|
|---|
| Try MShigh |
|
|---|
| ChTry MShigh |
|
|---|
| ArgC MShigh |
|
|---|
| LysN MShigh |
|
|---|
| TryLysC MShigh |
|
|---|
General Statistics
Number of major isoforms |
Number of additional isoforms |
Number of all proteins |
Number of amino acids |
Min. Seq. Length |
Max. Seq. Length |
Avg. Seq. Length |
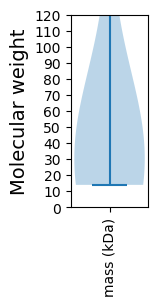
Avg. Mol. Weight |
|---|---|---|---|---|---|---|---|
0 |
4091 |
125 |
2120 |
511.4 |
58.32 |
Amino acid frequency
Ala |
Cys |
Asp |
Glu |
Phe |
Gly |
His |
Ile |
Lys |
Leu |
|---|---|---|---|---|---|---|---|---|---|
3.74 ± 0.295 | 2.151 ± 0.28 |
5.475 ± 0.409 | 5.353 ± 0.253 |
3.667 ± 0.378 | 5.353 ± 0.278 |
2.982 ± 0.333 | 8.726 ± 0.436 |
7.162 ± 1.035 | 10.364 ± 0.942 |
Met |
Asn |
Gln |
Pro |
Arg |
Ser |
Thr |
Val |
Trp |
Tyr |
|---|---|---|---|---|---|---|---|---|---|
2.64 ± 0.342 | 5.5 ± 0.369 |
5.109 ± 0.317 | 2.909 ± 0.181 |
4.351 ± 0.324 | 8.409 ± 0.587 |
5.989 ± 0.92 | 4.571 ± 0.247 |
1.76 ± 0.278 | 3.789 ± 0.297 |
Most of the basic statistics you can see at this page can be downloaded from this CSV file
See this proteome in:

Proteome-pI is available under Creative Commons Attribution-NoDerivs license, for more details see here
| Reference: Kozlowski LP. Proteome-pI 2.0: Proteome Isoelectric Point Database Update. Nucleic Acids Res. 2021, doi: 10.1093/nar/gkab944 | Contact: Lukasz P. Kozlowski |