Bartonella bacilliformis (strain ATCC 35685 / NCTC 12138 / KC583)
Taxonomy: cellular organisms; Bacteria; Proteobacteria; Alphaproteobacteria; Hyphomicrobiales; Bartonellaceae; Bartonella; Bartonella bacilliformis
Average proteome isoelectric point is 6.94
Get precalculated fractions of proteins
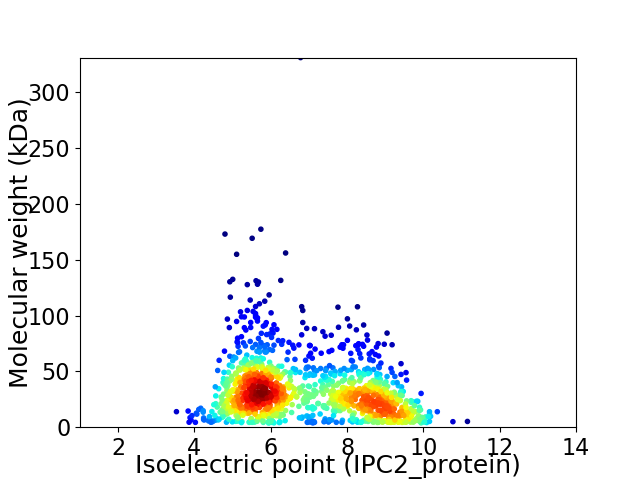
Virtual 2D-PAGE plot for 1255 proteins (isoelectric point calculated using IPC2_protein)
Get csv file with sequences according to given criteria:
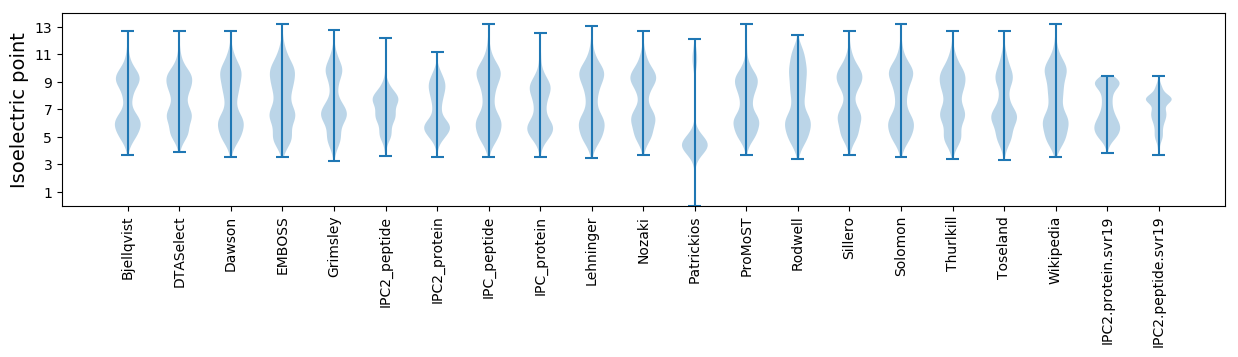
* You can choose from 21 different methods for calculating isoelectric point
Summary statistics related to proteome-wise predictions
Protein with the lowest isoelectric point:
>sp|A1UTZ3|GPDA_BARBK Glycerol-3-phosphate dehydrogenase [NAD(P)+] OS=Bartonella bacilliformis (strain ATCC 35685 / NCTC 12138 / KC583) OX=360095 GN=gpsA PE=3 SV=1
MM1 pKa = 7.45CVSFDD6 pKa = 3.56VVFAMILMCEE16 pKa = 4.5LEE18 pKa = 4.41NVLDD22 pKa = 4.08RR23 pKa = 11.84YY24 pKa = 10.09VLNEE28 pKa = 3.93EE29 pKa = 4.16QGDD32 pKa = 4.53GIWDD36 pKa = 3.67KK37 pKa = 11.43QQ38 pKa = 3.36
MM1 pKa = 7.45CVSFDD6 pKa = 3.56VVFAMILMCEE16 pKa = 4.5LEE18 pKa = 4.41NVLDD22 pKa = 4.08RR23 pKa = 11.84YY24 pKa = 10.09VLNEE28 pKa = 3.93EE29 pKa = 4.16QGDD32 pKa = 4.53GIWDD36 pKa = 3.67KK37 pKa = 11.43QQ38 pKa = 3.36
Molecular weight: 4.45 kDa
Isoelectric point according different methods:
Protein with the highest isoelectric point:
>tr|A1UTN3|A1UTN3_BARBK Uncharacterized protein OS=Bartonella bacilliformis (strain ATCC 35685 / NCTC 12138 / KC583) OX=360095 GN=BARBAKC583_1064 PE=4 SV=1
MM1 pKa = 7.35KK2 pKa = 9.43RR3 pKa = 11.84TYY5 pKa = 10.27QPSKK9 pKa = 9.73LVRR12 pKa = 11.84KK13 pKa = 9.15RR14 pKa = 11.84RR15 pKa = 11.84HH16 pKa = 4.42GFRR19 pKa = 11.84ARR21 pKa = 11.84MATAGGRR28 pKa = 11.84KK29 pKa = 9.11VIAARR34 pKa = 11.84RR35 pKa = 11.84LRR37 pKa = 11.84GRR39 pKa = 11.84KK40 pKa = 9.05RR41 pKa = 11.84LSAA44 pKa = 4.03
MM1 pKa = 7.35KK2 pKa = 9.43RR3 pKa = 11.84TYY5 pKa = 10.27QPSKK9 pKa = 9.73LVRR12 pKa = 11.84KK13 pKa = 9.15RR14 pKa = 11.84RR15 pKa = 11.84HH16 pKa = 4.42GFRR19 pKa = 11.84ARR21 pKa = 11.84MATAGGRR28 pKa = 11.84KK29 pKa = 9.11VIAARR34 pKa = 11.84RR35 pKa = 11.84LRR37 pKa = 11.84GRR39 pKa = 11.84KK40 pKa = 9.05RR41 pKa = 11.84LSAA44 pKa = 4.03
Molecular weight: 5.15 kDa
Isoelectric point according different methods:
Peptides (in silico digests for buttom-up proteomics)
Below you can find in silico digests of the whole proteome with Trypsin, Chymotrypsin, Trypsin+LysC, LysN, ArgC proteases suitable for different mass spec machines.| Try ESI |
 |
|---|
| ChTry ESI |
|
|---|
| ArgC ESI |
|
|---|
| LysN ESI |
|
|---|
| TryLysC ESI |
|
|---|
| Try MALDI |
|
|---|
| ChTry MALDI |
|
|---|
| ArgC MALDI |
|
|---|
| LysN MALDI |
|
|---|
| TryLysC MALDI |
|
|---|
| Try LTQ |
|
|---|
| ChTry LTQ |
|
|---|
| ArgC LTQ |
|
|---|
| LysN LTQ |
|
|---|
| TryLysC LTQ |
|
|---|
| Try MSlow |
|
|---|
| ChTry MSlow |
|
|---|
| ArgC MSlow |
|
|---|
| LysN MSlow |
|
|---|
| TryLysC MSlow |
|
|---|
| Try MShigh |
|
|---|
| ChTry MShigh |
|
|---|
| ArgC MShigh |
|
|---|
| LysN MShigh |
|
|---|
| TryLysC MShigh |
|
|---|
General Statistics
Number of major isoforms |
Number of additional isoforms |
Number of all proteins |
Number of amino acids |
Min. Seq. Length |
Max. Seq. Length |
Avg. Seq. Length |
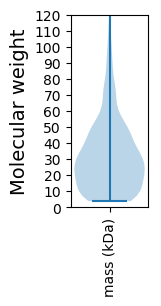
Avg. Mol. Weight |
|---|---|---|---|---|---|---|---|
0 |
380800 |
37 |
2884 |
303.4 |
33.84 |
Amino acid frequency
Ala |
Cys |
Asp |
Glu |
Phe |
Gly |
His |
Ile |
Lys |
Leu |
|---|---|---|---|---|---|---|---|---|---|
8.262 ± 0.073 | 1.067 ± 0.027 |
5.223 ± 0.049 | 5.987 ± 0.062 |
4.463 ± 0.057 | 6.805 ± 0.079 |
2.405 ± 0.038 | 7.788 ± 0.061 |
5.75 ± 0.051 | 9.869 ± 0.073 |
Met |
Asn |
Gln |
Pro |
Arg |
Ser |
Thr |
Val |
Trp |
Tyr |
|---|---|---|---|---|---|---|---|---|---|
2.547 ± 0.033 | 4.315 ± 0.053 |
3.973 ± 0.053 | 4.029 ± 0.045 |
5.318 ± 0.053 | 6.526 ± 0.056 |
5.319 ± 0.05 | 6.468 ± 0.058 |
1.093 ± 0.025 | 2.794 ± 0.039 |
Most of the basic statistics you can see at this page can be downloaded from this CSV file
See this proteome in:

Proteome-pI is available under Creative Commons Attribution-NoDerivs license, for more details see here
| Reference: Kozlowski LP. Proteome-pI 2.0: Proteome Isoelectric Point Database Update. Nucleic Acids Res. 2021, doi: 10.1093/nar/gkab944 | Contact: Lukasz P. Kozlowski |