Acinetobacter phage Presley
Taxonomy: Viruses; Duplodnaviria; Heunggongvirae; Uroviricota; Caudoviricetes; Caudovirales; Schitoviridae; Presleyvirus; Acinetobacter virus Presley
Average proteome isoelectric point is 6.22
Get precalculated fractions of proteins
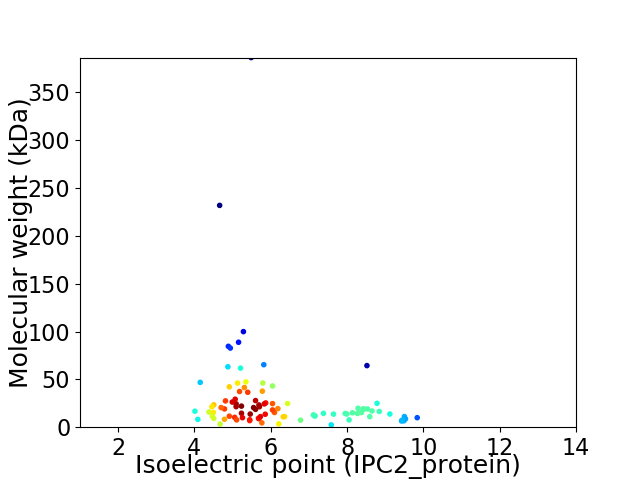
Virtual 2D-PAGE plot for 94 proteins (isoelectric point calculated using IPC2_protein)
Get csv file with sequences according to given criteria:
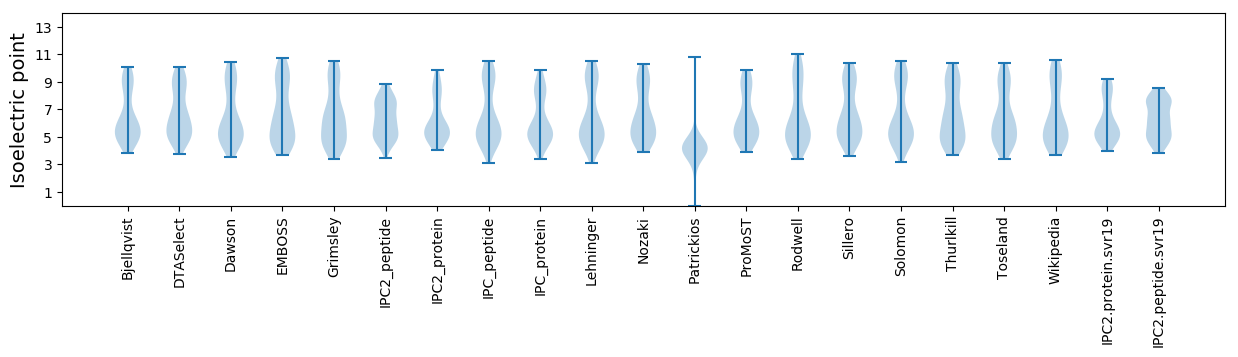
* You can choose from 21 different methods for calculating isoelectric point
Summary statistics related to proteome-wise predictions
Protein with the lowest isoelectric point:
>tr|U5PZZ5|U5PZZ5_9CAUD Structural protein OS=Acinetobacter phage Presley OX=1406780 GN=Presley_81 PE=4 SV=1
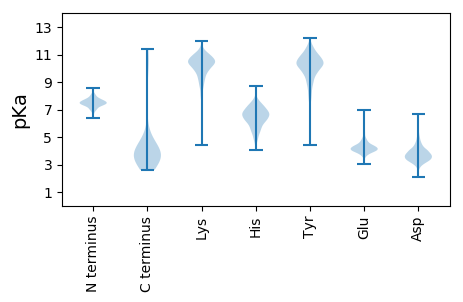
MM1 pKa = 7.46INVIEE6 pKa = 4.39QYY8 pKa = 9.67TVSDD12 pKa = 3.61QCVMQLNHH20 pKa = 6.93HH21 pKa = 6.63IEE23 pKa = 4.11AGIYY27 pKa = 9.11TVDD30 pKa = 3.53LNYY33 pKa = 10.42MNGAVIATMMGSKK46 pKa = 10.35NEE48 pKa = 4.14STATWFYY55 pKa = 11.24EE56 pKa = 3.92NLEE59 pKa = 4.05GSYY62 pKa = 11.12EE63 pKa = 3.98EE64 pKa = 4.25LAEE67 pKa = 4.13VQANGEE73 pKa = 4.12
MM1 pKa = 7.46INVIEE6 pKa = 4.39QYY8 pKa = 9.67TVSDD12 pKa = 3.61QCVMQLNHH20 pKa = 6.93HH21 pKa = 6.63IEE23 pKa = 4.11AGIYY27 pKa = 9.11TVDD30 pKa = 3.53LNYY33 pKa = 10.42MNGAVIATMMGSKK46 pKa = 10.35NEE48 pKa = 4.14STATWFYY55 pKa = 11.24EE56 pKa = 3.92NLEE59 pKa = 4.05GSYY62 pKa = 11.12EE63 pKa = 3.98EE64 pKa = 4.25LAEE67 pKa = 4.13VQANGEE73 pKa = 4.12
Molecular weight: 8.21 kDa
Isoelectric point according different methods:
Protein with the highest isoelectric point:
>tr|U5PVX8|U5PVX8_9CAUD Uncharacterized protein OS=Acinetobacter phage Presley OX=1406780 GN=Presley_78 PE=4 SV=1
MM1 pKa = 7.4NKK3 pKa = 10.31AIMVVGVVIGSIILITVVAYY23 pKa = 9.74VISLIVMVVTYY34 pKa = 8.53VLPFVVIVFCIGYY47 pKa = 10.31ASCLYY52 pKa = 10.49NKK54 pKa = 9.95RR55 pKa = 11.84KK56 pKa = 9.99KK57 pKa = 10.0RR58 pKa = 11.84DD59 pKa = 3.17RR60 pKa = 3.84
MM1 pKa = 7.4NKK3 pKa = 10.31AIMVVGVVIGSIILITVVAYY23 pKa = 9.74VISLIVMVVTYY34 pKa = 8.53VLPFVVIVFCIGYY47 pKa = 10.31ASCLYY52 pKa = 10.49NKK54 pKa = 9.95RR55 pKa = 11.84KK56 pKa = 9.99KK57 pKa = 10.0RR58 pKa = 11.84DD59 pKa = 3.17RR60 pKa = 3.84
Molecular weight: 6.69 kDa
Isoelectric point according different methods:
Peptides (in silico digests for buttom-up proteomics)
Below you can find in silico digests of the whole proteome with Trypsin, Chymotrypsin, Trypsin+LysC, LysN, ArgC proteases suitable for different mass spec machines.| Try ESI |
 |
|---|
| ChTry ESI |
|
|---|
| ArgC ESI |
|
|---|
| LysN ESI |
|
|---|
| TryLysC ESI |
|
|---|
| Try MALDI |
|
|---|
| ChTry MALDI |
|
|---|
| ArgC MALDI |
|
|---|
| LysN MALDI |
|
|---|
| TryLysC MALDI |
|
|---|
| Try LTQ |
|
|---|
| ChTry LTQ |
|
|---|
| ArgC LTQ |
|
|---|
| LysN LTQ |
|
|---|
| TryLysC LTQ |
|
|---|
| Try MSlow |
|
|---|
| ChTry MSlow |
|
|---|
| ArgC MSlow |
|
|---|
| LysN MSlow |
|
|---|
| TryLysC MSlow |
|
|---|
| Try MShigh |
|
|---|
| ChTry MShigh |
|
|---|
| ArgC MShigh |
|
|---|
| LysN MShigh |
|
|---|
| TryLysC MShigh |
|
|---|
General Statistics
Number of major isoforms |
Number of additional isoforms |
Number of all proteins |
Number of amino acids |
Min. Seq. Length |
Max. Seq. Length |
Avg. Seq. Length |
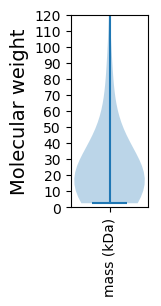
Avg. Mol. Weight |
|---|---|---|---|---|---|---|---|
0 |
24559 |
20 |
3492 |
261.3 |
29.38 |
Amino acid frequency
Ala |
Cys |
Asp |
Glu |
Phe |
Gly |
His |
Ile |
Lys |
Leu |
|---|---|---|---|---|---|---|---|---|---|
7.928 ± 0.447 | 0.745 ± 0.132 |
6.564 ± 0.197 | 6.515 ± 0.249 |
3.665 ± 0.205 | 5.937 ± 0.245 |
2.02 ± 0.171 | 6.735 ± 0.301 |
6.657 ± 0.218 | 8.608 ± 0.215 |
Met |
Asn |
Gln |
Pro |
Arg |
Ser |
Thr |
Val |
Trp |
Tyr |
|---|---|---|---|---|---|---|---|---|---|
2.765 ± 0.157 | 5.904 ± 0.253 |
3.766 ± 0.165 | 4.52 ± 0.291 |
4.247 ± 0.135 | 5.859 ± 0.251 |
6.368 ± 0.257 | 6.128 ± 0.221 |
1.022 ± 0.102 | 4.047 ± 0.222 |
Most of the basic statistics you can see at this page can be downloaded from this CSV file
See this proteome in:

Proteome-pI is available under Creative Commons Attribution-NoDerivs license, for more details see here
| Reference: Kozlowski LP. Proteome-pI 2.0: Proteome Isoelectric Point Database Update. Nucleic Acids Res. 2021, doi: 10.1093/nar/gkab944 | Contact: Lukasz P. Kozlowski |