Aeromonas phage D3
Taxonomy: Viruses; Duplodnaviria; Heunggongvirae; Uroviricota; Caudoviricetes; Caudovirales; Myoviridae; unclassified Myoviridae
Average proteome isoelectric point is 6.14
Get precalculated fractions of proteins
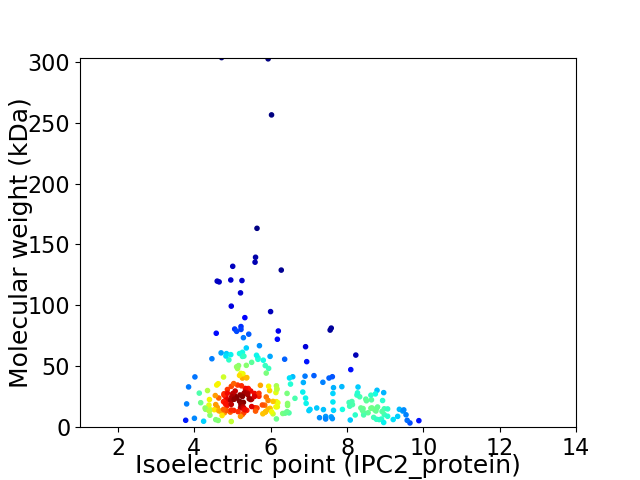
Virtual 2D-PAGE plot for 267 proteins (isoelectric point calculated using IPC2_protein)
Get csv file with sequences according to given criteria:
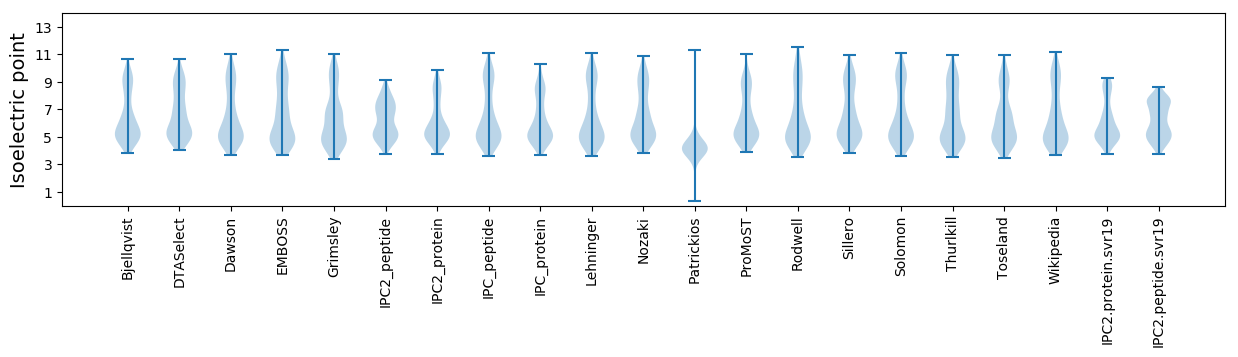
* You can choose from 21 different methods for calculating isoelectric point
Summary statistics related to proteome-wise predictions
Protein with the lowest isoelectric point:
>tr|A0A514TVI8|A0A514TVI8_9CAUD Uncharacterized protein OS=Aeromonas phage D3 OX=2593327 GN=D3_0044 PE=4 SV=1
MM1 pKa = 7.61CGSDD5 pKa = 3.66TPFVLQDD12 pKa = 3.84TIVHH16 pKa = 6.83LDD18 pKa = 3.65LLIDD22 pKa = 3.74EE23 pKa = 4.81VDD25 pKa = 3.5RR26 pKa = 11.84SKK28 pKa = 11.67DD29 pKa = 3.13LANFYY34 pKa = 11.14FEE36 pKa = 4.86GNIFIIVEE44 pKa = 4.12DD45 pKa = 4.26PYY47 pKa = 11.4GTVV50 pKa = 2.95
MM1 pKa = 7.61CGSDD5 pKa = 3.66TPFVLQDD12 pKa = 3.84TIVHH16 pKa = 6.83LDD18 pKa = 3.65LLIDD22 pKa = 3.74EE23 pKa = 4.81VDD25 pKa = 3.5RR26 pKa = 11.84SKK28 pKa = 11.67DD29 pKa = 3.13LANFYY34 pKa = 11.14FEE36 pKa = 4.86GNIFIIVEE44 pKa = 4.12DD45 pKa = 4.26PYY47 pKa = 11.4GTVV50 pKa = 2.95
Molecular weight: 5.68 kDa
Isoelectric point according different methods:
Protein with the highest isoelectric point:
>tr|A0A514TVK5|A0A514TVK5_9CAUD Uncharacterized protein OS=Aeromonas phage D3 OX=2593327 GN=D3_0058 PE=4 SV=1
MM1 pKa = 7.34FEE3 pKa = 5.02AMSNSQAFGFAFFGAIGVIAVIAIGANEE31 pKa = 3.83YY32 pKa = 10.62FKK34 pKa = 11.16AKK36 pKa = 10.0KK37 pKa = 9.68ALKK40 pKa = 10.21RR41 pKa = 11.84PMATRR46 pKa = 11.84NKK48 pKa = 10.12RR49 pKa = 3.23
MM1 pKa = 7.34FEE3 pKa = 5.02AMSNSQAFGFAFFGAIGVIAVIAIGANEE31 pKa = 3.83YY32 pKa = 10.62FKK34 pKa = 11.16AKK36 pKa = 10.0KK37 pKa = 9.68ALKK40 pKa = 10.21RR41 pKa = 11.84PMATRR46 pKa = 11.84NKK48 pKa = 10.12RR49 pKa = 3.23
Molecular weight: 5.37 kDa
Isoelectric point according different methods:
Peptides (in silico digests for buttom-up proteomics)
Below you can find in silico digests of the whole proteome with Trypsin, Chymotrypsin, Trypsin+LysC, LysN, ArgC proteases suitable for different mass spec machines.| Try ESI |
 |
|---|
| ChTry ESI |
|
|---|
| ArgC ESI |
|
|---|
| LysN ESI |
|
|---|
| TryLysC ESI |
|
|---|
| Try MALDI |
|
|---|
| ChTry MALDI |
|
|---|
| ArgC MALDI |
|
|---|
| LysN MALDI |
|
|---|
| TryLysC MALDI |
|
|---|
| Try LTQ |
|
|---|
| ChTry LTQ |
|
|---|
| ArgC LTQ |
|
|---|
| LysN LTQ |
|
|---|
| TryLysC LTQ |
|
|---|
| Try MSlow |
|
|---|
| ChTry MSlow |
|
|---|
| ArgC MSlow |
|
|---|
| LysN MSlow |
|
|---|
| TryLysC MSlow |
|
|---|
| Try MShigh |
|
|---|
| ChTry MShigh |
|
|---|
| ArgC MShigh |
|
|---|
| LysN MShigh |
|
|---|
| TryLysC MShigh |
|
|---|
General Statistics
Number of major isoforms |
Number of additional isoforms |
Number of all proteins |
Number of amino acids |
Min. Seq. Length |
Max. Seq. Length |
Avg. Seq. Length |
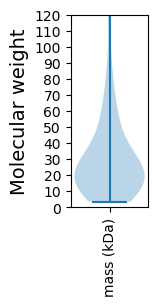
Avg. Mol. Weight |
|---|---|---|---|---|---|---|---|
0 |
82310 |
30 |
2794 |
308.3 |
34.76 |
Amino acid frequency
Ala |
Cys |
Asp |
Glu |
Phe |
Gly |
His |
Ile |
Lys |
Leu |
|---|---|---|---|---|---|---|---|---|---|
6.488 ± 0.156 | 0.914 ± 0.051 |
6.386 ± 0.091 | 6.694 ± 0.17 |
4.615 ± 0.117 | 6.824 ± 0.141 |
2.023 ± 0.079 | 6.296 ± 0.144 |
6.275 ± 0.124 | 8.178 ± 0.172 |
Met |
Asn |
Gln |
Pro |
Arg |
Ser |
Thr |
Val |
Trp |
Tyr |
|---|---|---|---|---|---|---|---|---|---|
3.201 ± 0.094 | 5.437 ± 0.153 |
4.047 ± 0.125 | 3.303 ± 0.1 |
4.775 ± 0.116 | 5.988 ± 0.101 |
6.333 ± 0.203 | 7.183 ± 0.157 |
1.189 ± 0.072 | 3.851 ± 0.098 |
Most of the basic statistics you can see at this page can be downloaded from this CSV file
See this proteome in:

Proteome-pI is available under Creative Commons Attribution-NoDerivs license, for more details see here
| Reference: Kozlowski LP. Proteome-pI 2.0: Proteome Isoelectric Point Database Update. Nucleic Acids Res. 2021, doi: 10.1093/nar/gkab944 | Contact: Lukasz P. Kozlowski |