Ideonella sakaiensis (strain NBRC 110686 / TISTR 2288 / 201-F6)
Taxonomy: cellular organisms; Bacteria; Proteobacteria; Betaproteobacteria; Burkholderiales; Burkholderiales genera incertae sedis; Ideonella
Average proteome isoelectric point is 7.25
Get precalculated fractions of proteins
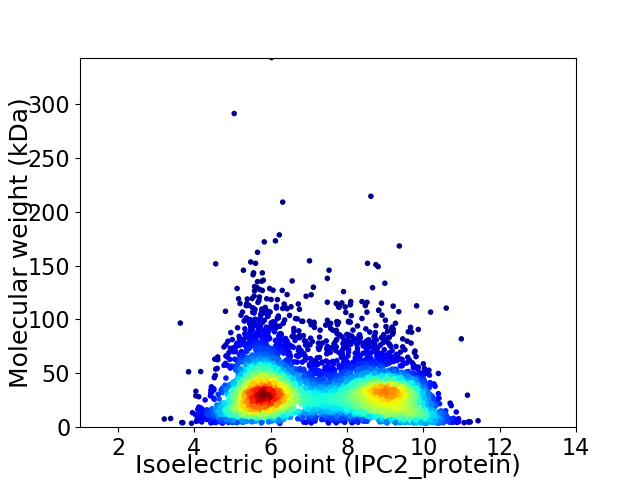
Virtual 2D-PAGE plot for 5527 proteins (isoelectric point calculated using IPC2_protein)
Get csv file with sequences according to given criteria:
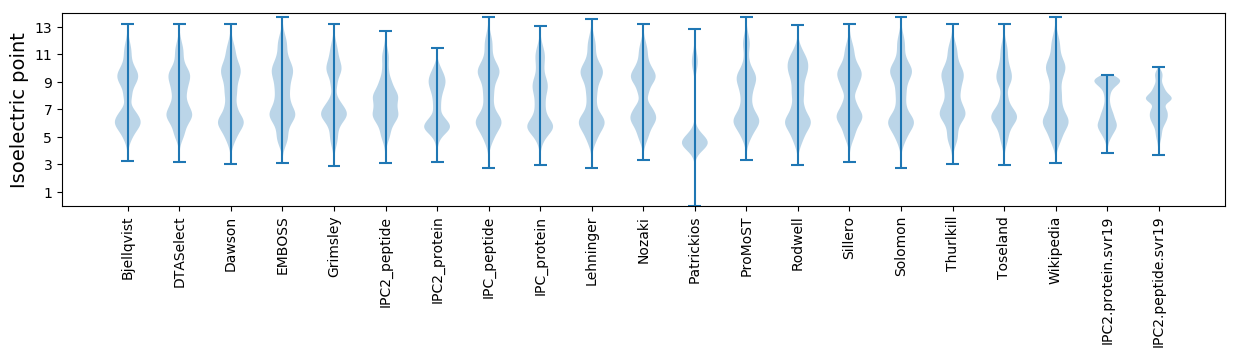
* You can choose from 21 different methods for calculating isoelectric point
Summary statistics related to proteome-wise predictions
Protein with the lowest isoelectric point:
>tr|A0A0K8P260|A0A0K8P260_IDESA Tricarboxylate transport protein TctB OS=Ideonella sakaiensis (strain NBRC 110686 / TISTR 2288 / 201-F6) OX=1547922 GN=ISF6_2484 PE=4 SV=1
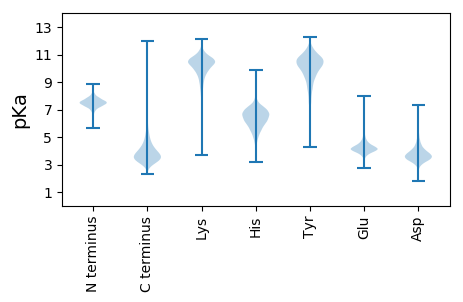
MM1 pKa = 7.14NAEE4 pKa = 4.38DD5 pKa = 4.91FDD7 pKa = 5.08VEE9 pKa = 4.57LTCPTCSRR17 pKa = 11.84HH18 pKa = 4.67FQAGVTEE25 pKa = 4.39LLARR29 pKa = 11.84PIATCPCGQPVQVDD43 pKa = 3.64VAALRR48 pKa = 11.84EE49 pKa = 4.2SLGLDD54 pKa = 3.18EE55 pKa = 6.27GDD57 pKa = 3.38
MM1 pKa = 7.14NAEE4 pKa = 4.38DD5 pKa = 4.91FDD7 pKa = 5.08VEE9 pKa = 4.57LTCPTCSRR17 pKa = 11.84HH18 pKa = 4.67FQAGVTEE25 pKa = 4.39LLARR29 pKa = 11.84PIATCPCGQPVQVDD43 pKa = 3.64VAALRR48 pKa = 11.84EE49 pKa = 4.2SLGLDD54 pKa = 3.18EE55 pKa = 6.27GDD57 pKa = 3.38
Molecular weight: 6.09 kDa
Isoelectric point according different methods:
Protein with the highest isoelectric point:
>tr|A0A0K8NYC9|A0A0K8NYC9_IDESA Putative exported protein OS=Ideonella sakaiensis (strain NBRC 110686 / TISTR 2288 / 201-F6) OX=1547922 GN=ISF6_1149 PE=4 SV=1
MM1 pKa = 7.16SQPPGRR7 pKa = 11.84RR8 pKa = 11.84PARR11 pKa = 11.84RR12 pKa = 11.84RR13 pKa = 11.84LAGPPAPGRR22 pKa = 11.84APARR26 pKa = 11.84ASPPGGRR33 pKa = 11.84RR34 pKa = 11.84GTMRR38 pKa = 11.84IGPAAGLARR47 pKa = 11.84PP48 pKa = 4.06
MM1 pKa = 7.16SQPPGRR7 pKa = 11.84RR8 pKa = 11.84PARR11 pKa = 11.84RR12 pKa = 11.84RR13 pKa = 11.84LAGPPAPGRR22 pKa = 11.84APARR26 pKa = 11.84ASPPGGRR33 pKa = 11.84RR34 pKa = 11.84GTMRR38 pKa = 11.84IGPAAGLARR47 pKa = 11.84PP48 pKa = 4.06
Molecular weight: 4.91 kDa
Isoelectric point according different methods:
Peptides (in silico digests for buttom-up proteomics)
Below you can find in silico digests of the whole proteome with Trypsin, Chymotrypsin, Trypsin+LysC, LysN, ArgC proteases suitable for different mass spec machines.| Try ESI |
 |
|---|
| ChTry ESI |
|
|---|
| ArgC ESI |
|
|---|
| LysN ESI |
|
|---|
| TryLysC ESI |
|
|---|
| Try MALDI |
|
|---|
| ChTry MALDI |
|
|---|
| ArgC MALDI |
|
|---|
| LysN MALDI |
|
|---|
| TryLysC MALDI |
|
|---|
| Try LTQ |
|
|---|
| ChTry LTQ |
|
|---|
| ArgC LTQ |
|
|---|
| LysN LTQ |
|
|---|
| TryLysC LTQ |
|
|---|
| Try MSlow |
|
|---|
| ChTry MSlow |
|
|---|
| ArgC MSlow |
|
|---|
| LysN MSlow |
|
|---|
| TryLysC MSlow |
|
|---|
| Try MShigh |
|
|---|
| ChTry MShigh |
|
|---|
| ArgC MShigh |
|
|---|
| LysN MShigh |
|
|---|
| TryLysC MShigh |
|
|---|
General Statistics
Number of major isoforms |
Number of additional isoforms |
Number of all proteins |
Number of amino acids |
Min. Seq. Length |
Max. Seq. Length |
Avg. Seq. Length |
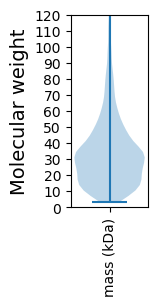
Avg. Mol. Weight |
|---|---|---|---|---|---|---|---|
0 |
1811574 |
37 |
3234 |
327.8 |
35.17 |
Amino acid frequency
Ala |
Cys |
Asp |
Glu |
Phe |
Gly |
His |
Ile |
Lys |
Leu |
|---|---|---|---|---|---|---|---|---|---|
15.184 ± 0.061 | 0.894 ± 0.011 |
5.322 ± 0.022 | 5.12 ± 0.023 |
3.052 ± 0.022 | 9.028 ± 0.031 |
2.195 ± 0.018 | 3.314 ± 0.026 |
2.107 ± 0.034 | 11.182 ± 0.046 |
Met |
Asn |
Gln |
Pro |
Arg |
Ser |
Thr |
Val |
Trp |
Tyr |
|---|---|---|---|---|---|---|---|---|---|
2.006 ± 0.016 | 1.873 ± 0.021 |
6.368 ± 0.037 | 3.566 ± 0.021 |
8.603 ± 0.043 | 4.538 ± 0.024 |
4.605 ± 0.026 | 7.631 ± 0.027 |
1.545 ± 0.016 | 1.865 ± 0.016 |
Most of the basic statistics you can see at this page can be downloaded from this CSV file
See this proteome in:

Proteome-pI is available under Creative Commons Attribution-NoDerivs license, for more details see here
| Reference: Kozlowski LP. Proteome-pI 2.0: Proteome Isoelectric Point Database Update. Nucleic Acids Res. 2021, doi: 10.1093/nar/gkab944 | Contact: Lukasz P. Kozlowski |