Mycobacterium virus Kugel
Taxonomy: Viruses; Duplodnaviria; Heunggongvirae; Uroviricota; Caudoviricetes; Caudovirales; Siphoviridae; Fromanvirus
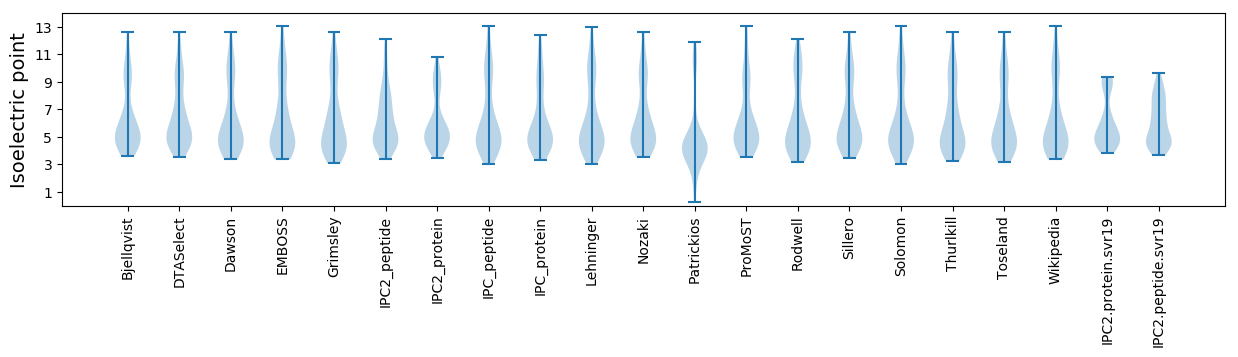
Average proteome isoelectric point is 6.06
Get precalculated fractions of proteins
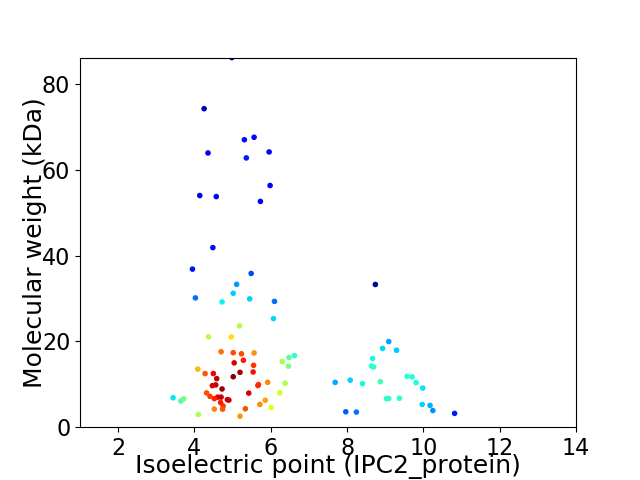
Virtual 2D-PAGE plot for 95 proteins (isoelectric point calculated using IPC2_protein)
Get csv file with sequences according to given criteria:
* You can choose from 21 different methods for calculating isoelectric point
Summary statistics related to proteome-wise predictions
Protein with the lowest isoelectric point:
>tr|G8IB42|G8IB42_9CAUD Uncharacterized protein OS=Mycobacterium virus Kugel OX=1089128 GN=4 PE=4 SV=1
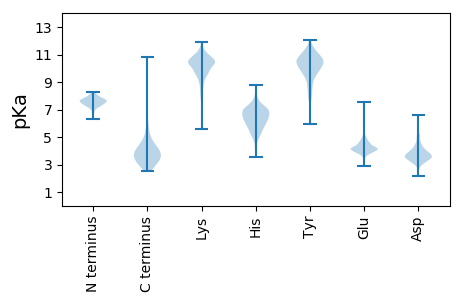
MM1 pKa = 7.77EE2 pKa = 6.48DD3 pKa = 3.64EE4 pKa = 5.94DD5 pKa = 6.01LDD7 pKa = 4.42ADD9 pKa = 5.56RR10 pKa = 11.84NDD12 pKa = 3.8CVHH15 pKa = 6.43GVEE18 pKa = 5.36GPCPVCLPEE27 pKa = 4.69LFEE30 pKa = 5.26DD31 pKa = 4.72GPYY34 pKa = 10.5QFFPQRR40 pKa = 11.84YY41 pKa = 5.99ITGVEE46 pKa = 3.99DD47 pKa = 3.63PLLIEE52 pKa = 4.71EE53 pKa = 4.7GG54 pKa = 3.62
MM1 pKa = 7.77EE2 pKa = 6.48DD3 pKa = 3.64EE4 pKa = 5.94DD5 pKa = 6.01LDD7 pKa = 4.42ADD9 pKa = 5.56RR10 pKa = 11.84NDD12 pKa = 3.8CVHH15 pKa = 6.43GVEE18 pKa = 5.36GPCPVCLPEE27 pKa = 4.69LFEE30 pKa = 5.26DD31 pKa = 4.72GPYY34 pKa = 10.5QFFPQRR40 pKa = 11.84YY41 pKa = 5.99ITGVEE46 pKa = 3.99DD47 pKa = 3.63PLLIEE52 pKa = 4.71EE53 pKa = 4.7GG54 pKa = 3.62
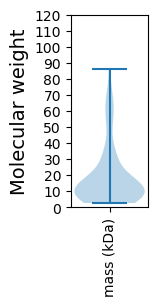
Molecular weight: 6.11 kDa
Isoelectric point according different methods:
Protein with the highest isoelectric point:
>tr|G8IBC8|G8IBC8_9CAUD Uncharacterized protein OS=Mycobacterium virus Kugel OX=1089128 GN=90 PE=4 SV=1
MM1 pKa = 6.8TRR3 pKa = 11.84NGIGVGNPSRR13 pKa = 11.84NSSTNPLTRR22 pKa = 11.84NRR24 pKa = 11.84RR25 pKa = 11.84MPHH28 pKa = 4.13TT29 pKa = 4.09
MM1 pKa = 6.8TRR3 pKa = 11.84NGIGVGNPSRR13 pKa = 11.84NSSTNPLTRR22 pKa = 11.84NRR24 pKa = 11.84RR25 pKa = 11.84MPHH28 pKa = 4.13TT29 pKa = 4.09
Molecular weight: 3.22 kDa
Isoelectric point according different methods:
Peptides (in silico digests for buttom-up proteomics)
Below you can find in silico digests of the whole proteome with Trypsin, Chymotrypsin, Trypsin+LysC, LysN, ArgC proteases suitable for different mass spec machines.| Try ESI |
 |
|---|
| ChTry ESI |
|
|---|
| ArgC ESI |
|
|---|
| LysN ESI |
|
|---|
| TryLysC ESI |
|
|---|
| Try MALDI |
|
|---|
| ChTry MALDI |
|
|---|
| ArgC MALDI |
|
|---|
| LysN MALDI |
|
|---|
| TryLysC MALDI |
|
|---|
| Try LTQ |
|
|---|
| ChTry LTQ |
|
|---|
| ArgC LTQ |
|
|---|
| LysN LTQ |
|
|---|
| TryLysC LTQ |
|
|---|
| Try MSlow |
|
|---|
| ChTry MSlow |
|
|---|
| ArgC MSlow |
|
|---|
| LysN MSlow |
|
|---|
| TryLysC MSlow |
|
|---|
| Try MShigh |
|
|---|
| ChTry MShigh |
|
|---|
| ArgC MShigh |
|
|---|
| LysN MShigh |
|
|---|
| TryLysC MShigh |
|
|---|
General Statistics
Number of major isoforms |
Number of additional isoforms |
Number of all proteins |
Number of amino acids |
Min. Seq. Length |
Max. Seq. Length |
Avg. Seq. Length |
Avg. Mol. Weight |
|---|---|---|---|---|---|---|---|
0 |
16554 |
22 |
826 |
174.3 |
19.13 |
Amino acid frequency
Ala |
Cys |
Asp |
Glu |
Phe |
Gly |
His |
Ile |
Lys |
Leu |
|---|---|---|---|---|---|---|---|---|---|
10.016 ± 0.38 | 0.755 ± 0.128 |
6.554 ± 0.222 | 6.627 ± 0.328 |
3.117 ± 0.152 | 8.747 ± 0.508 |
2.09 ± 0.154 | 4.784 ± 0.206 |
4.041 ± 0.257 | 8.342 ± 0.305 |
Met |
Asn |
Gln |
Pro |
Arg |
Ser |
Thr |
Val |
Trp |
Tyr |
|---|---|---|---|---|---|---|---|---|---|
2.096 ± 0.103 | 3.099 ± 0.167 |
5.636 ± 0.25 | 3.171 ± 0.158 |
6.282 ± 0.403 | 5.938 ± 0.339 |
6.403 ± 0.273 | 7.201 ± 0.265 |
2.096 ± 0.118 | 3.002 ± 0.189 |
Most of the basic statistics you can see at this page can be downloaded from this CSV file
See this proteome in:

Proteome-pI is available under Creative Commons Attribution-NoDerivs license, for more details see here
| Reference: Kozlowski LP. Proteome-pI 2.0: Proteome Isoelectric Point Database Update. Nucleic Acids Res. 2021, doi: 10.1093/nar/gkab944 | Contact: Lukasz P. Kozlowski |