Ellagibacter isourolithinifaciens
Taxonomy: cellular organisms; Bacteria; Terrabacteria group; Actinobacteria; Coriobacteriia; Eggerthellales; Eggerthellaceae; Ellagibacter
Average proteome isoelectric point is 5.88
Get precalculated fractions of proteins
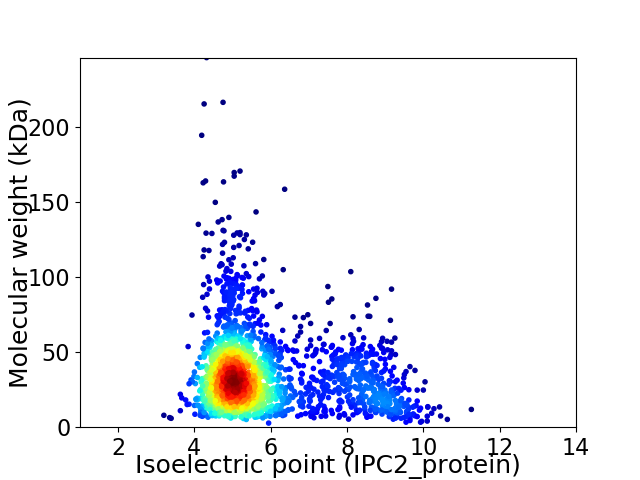
Virtual 2D-PAGE plot for 2050 proteins (isoelectric point calculated using IPC2_protein)
Get csv file with sequences according to given criteria:
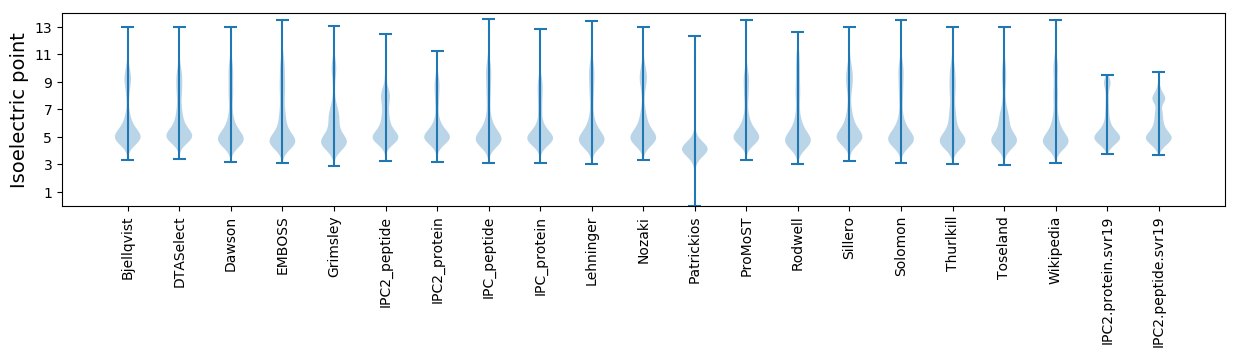
* You can choose from 21 different methods for calculating isoelectric point
Summary statistics related to proteome-wise predictions
Protein with the lowest isoelectric point:
>tr|A0A6N6NPH1|A0A6N6NPH1_9ACTN Phosphate acyltransferase OS=Ellagibacter isourolithinifaciens OX=2137581 GN=plsX PE=3 SV=1
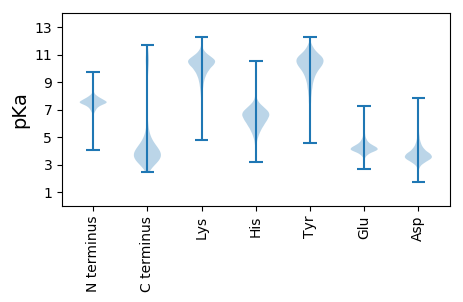
MM1 pKa = 8.16DD2 pKa = 4.72EE3 pKa = 4.35LSSVRR8 pKa = 11.84SSLRR12 pKa = 11.84VVSGDD17 pKa = 3.63PLSLEE22 pKa = 4.23VPAEE26 pKa = 3.98LFSPAEE32 pKa = 3.88FAQFEE37 pKa = 4.61GTVAVDD43 pKa = 3.75EE44 pKa = 5.2FEE46 pKa = 5.2CGPDD50 pKa = 2.91SYY52 pKa = 11.28RR53 pKa = 11.84FSEE56 pKa = 4.28PLSWHH61 pKa = 6.79ADD63 pKa = 3.23VSNTGDD69 pKa = 3.52ALLVTGNVTGEE80 pKa = 3.84ARR82 pKa = 11.84TDD84 pKa = 3.49CARR87 pKa = 11.84CLEE90 pKa = 4.42DD91 pKa = 4.17AVFDD95 pKa = 3.71IEE97 pKa = 5.47GEE99 pKa = 3.98IEE101 pKa = 5.16GYY103 pKa = 10.28FLLDD107 pKa = 3.25GAEE110 pKa = 4.05IPEE113 pKa = 4.59GADD116 pKa = 2.96EE117 pKa = 5.61DD118 pKa = 4.13EE119 pKa = 4.87FDD121 pKa = 4.39RR122 pKa = 11.84LPANHH127 pKa = 6.24VLDD130 pKa = 3.99MEE132 pKa = 4.79SLVVAAIVFEE142 pKa = 4.53LPLVPLCDD150 pKa = 3.96EE151 pKa = 4.68DD152 pKa = 5.77CKK154 pKa = 11.23GLCPTCGANLNEE166 pKa = 4.82GPCGCEE172 pKa = 4.04KK173 pKa = 10.4EE174 pKa = 4.67QSDD177 pKa = 4.66GPDD180 pKa = 3.11EE181 pKa = 5.09FEE183 pKa = 4.19LAKK186 pKa = 11.12NPFAALANFSFDD198 pKa = 3.45SDD200 pKa = 3.53EE201 pKa = 4.51SADD204 pKa = 3.54
MM1 pKa = 8.16DD2 pKa = 4.72EE3 pKa = 4.35LSSVRR8 pKa = 11.84SSLRR12 pKa = 11.84VVSGDD17 pKa = 3.63PLSLEE22 pKa = 4.23VPAEE26 pKa = 3.98LFSPAEE32 pKa = 3.88FAQFEE37 pKa = 4.61GTVAVDD43 pKa = 3.75EE44 pKa = 5.2FEE46 pKa = 5.2CGPDD50 pKa = 2.91SYY52 pKa = 11.28RR53 pKa = 11.84FSEE56 pKa = 4.28PLSWHH61 pKa = 6.79ADD63 pKa = 3.23VSNTGDD69 pKa = 3.52ALLVTGNVTGEE80 pKa = 3.84ARR82 pKa = 11.84TDD84 pKa = 3.49CARR87 pKa = 11.84CLEE90 pKa = 4.42DD91 pKa = 4.17AVFDD95 pKa = 3.71IEE97 pKa = 5.47GEE99 pKa = 3.98IEE101 pKa = 5.16GYY103 pKa = 10.28FLLDD107 pKa = 3.25GAEE110 pKa = 4.05IPEE113 pKa = 4.59GADD116 pKa = 2.96EE117 pKa = 5.61DD118 pKa = 4.13EE119 pKa = 4.87FDD121 pKa = 4.39RR122 pKa = 11.84LPANHH127 pKa = 6.24VLDD130 pKa = 3.99MEE132 pKa = 4.79SLVVAAIVFEE142 pKa = 4.53LPLVPLCDD150 pKa = 3.96EE151 pKa = 4.68DD152 pKa = 5.77CKK154 pKa = 11.23GLCPTCGANLNEE166 pKa = 4.82GPCGCEE172 pKa = 4.04KK173 pKa = 10.4EE174 pKa = 4.67QSDD177 pKa = 4.66GPDD180 pKa = 3.11EE181 pKa = 5.09FEE183 pKa = 4.19LAKK186 pKa = 11.12NPFAALANFSFDD198 pKa = 3.45SDD200 pKa = 3.53EE201 pKa = 4.51SADD204 pKa = 3.54
Molecular weight: 21.92 kDa
Isoelectric point according different methods:
Protein with the highest isoelectric point:
>tr|A0A6N6NJ98|A0A6N6NJ98_9ACTN Uncharacterized protein OS=Ellagibacter isourolithinifaciens OX=2137581 GN=F8C90_09595 PE=4 SV=1
MM1 pKa = 7.27KK2 pKa = 10.41RR3 pKa = 11.84SDD5 pKa = 3.67TRR7 pKa = 11.84WKK9 pKa = 8.92PKK11 pKa = 8.77RR12 pKa = 11.84RR13 pKa = 11.84RR14 pKa = 11.84RR15 pKa = 11.84RR16 pKa = 11.84RR17 pKa = 11.84ARR19 pKa = 11.84RR20 pKa = 11.84ARR22 pKa = 11.84RR23 pKa = 11.84PPPRR27 pKa = 11.84KK28 pKa = 8.93PRR30 pKa = 11.84SPPSRR35 pKa = 11.84RR36 pKa = 11.84PKK38 pKa = 10.12RR39 pKa = 11.84LRR41 pKa = 11.84PNPPSRR47 pKa = 11.84RR48 pKa = 11.84PKK50 pKa = 9.88RR51 pKa = 11.84RR52 pKa = 11.84RR53 pKa = 11.84PSPRR57 pKa = 11.84SNGARR62 pKa = 11.84HH63 pKa = 4.66WRR65 pKa = 11.84RR66 pKa = 11.84RR67 pKa = 11.84PSRR70 pKa = 11.84WATSRR75 pKa = 11.84ASTCARR81 pKa = 11.84RR82 pKa = 11.84SRR84 pKa = 11.84SNRR87 pKa = 11.84RR88 pKa = 11.84SSGPSPTTAPP98 pKa = 3.62
MM1 pKa = 7.27KK2 pKa = 10.41RR3 pKa = 11.84SDD5 pKa = 3.67TRR7 pKa = 11.84WKK9 pKa = 8.92PKK11 pKa = 8.77RR12 pKa = 11.84RR13 pKa = 11.84RR14 pKa = 11.84RR15 pKa = 11.84RR16 pKa = 11.84RR17 pKa = 11.84ARR19 pKa = 11.84RR20 pKa = 11.84ARR22 pKa = 11.84RR23 pKa = 11.84PPPRR27 pKa = 11.84KK28 pKa = 8.93PRR30 pKa = 11.84SPPSRR35 pKa = 11.84RR36 pKa = 11.84PKK38 pKa = 10.12RR39 pKa = 11.84LRR41 pKa = 11.84PNPPSRR47 pKa = 11.84RR48 pKa = 11.84PKK50 pKa = 9.88RR51 pKa = 11.84RR52 pKa = 11.84RR53 pKa = 11.84PSPRR57 pKa = 11.84SNGARR62 pKa = 11.84HH63 pKa = 4.66WRR65 pKa = 11.84RR66 pKa = 11.84RR67 pKa = 11.84PSRR70 pKa = 11.84WATSRR75 pKa = 11.84ASTCARR81 pKa = 11.84RR82 pKa = 11.84SRR84 pKa = 11.84SNRR87 pKa = 11.84RR88 pKa = 11.84SSGPSPTTAPP98 pKa = 3.62
Molecular weight: 11.84 kDa
Isoelectric point according different methods:
Peptides (in silico digests for buttom-up proteomics)
Below you can find in silico digests of the whole proteome with Trypsin, Chymotrypsin, Trypsin+LysC, LysN, ArgC proteases suitable for different mass spec machines.| Try ESI |
 |
|---|
| ChTry ESI |
|
|---|
| ArgC ESI |
|
|---|
| LysN ESI |
|
|---|
| TryLysC ESI |
|
|---|
| Try MALDI |
|
|---|
| ChTry MALDI |
|
|---|
| ArgC MALDI |
|
|---|
| LysN MALDI |
|
|---|
| TryLysC MALDI |
|
|---|
| Try LTQ |
|
|---|
| ChTry LTQ |
|
|---|
| ArgC LTQ |
|
|---|
| LysN LTQ |
|
|---|
| TryLysC LTQ |
|
|---|
| Try MSlow |
|
|---|
| ChTry MSlow |
|
|---|
| ArgC MSlow |
|
|---|
| LysN MSlow |
|
|---|
| TryLysC MSlow |
|
|---|
| Try MShigh |
|
|---|
| ChTry MShigh |
|
|---|
| ArgC MShigh |
|
|---|
| LysN MShigh |
|
|---|
| TryLysC MShigh |
|
|---|
General Statistics
Number of major isoforms |
Number of additional isoforms |
Number of all proteins |
Number of amino acids |
Min. Seq. Length |
Max. Seq. Length |
Avg. Seq. Length |
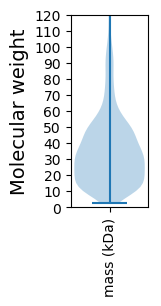
Avg. Mol. Weight |
|---|---|---|---|---|---|---|---|
0 |
699948 |
23 |
2285 |
341.4 |
37.23 |
Amino acid frequency
Ala |
Cys |
Asp |
Glu |
Phe |
Gly |
His |
Ile |
Lys |
Leu |
|---|---|---|---|---|---|---|---|---|---|
11.313 ± 0.078 | 1.749 ± 0.024 |
6.012 ± 0.045 | 6.838 ± 0.061 |
3.922 ± 0.038 | 8.065 ± 0.05 |
1.822 ± 0.022 | 5.319 ± 0.044 |
4.356 ± 0.044 | 8.846 ± 0.058 |
Met |
Asn |
Gln |
Pro |
Arg |
Ser |
Thr |
Val |
Trp |
Tyr |
|---|---|---|---|---|---|---|---|---|---|
2.678 ± 0.028 | 3.043 ± 0.032 |
4.263 ± 0.032 | 2.75 ± 0.026 |
5.896 ± 0.058 | 6.215 ± 0.049 |
5.175 ± 0.045 | 7.821 ± 0.043 |
1.094 ± 0.022 | 2.823 ± 0.033 |
Most of the basic statistics you can see at this page can be downloaded from this CSV file
See this proteome in:

Proteome-pI is available under Creative Commons Attribution-NoDerivs license, for more details see here
| Reference: Kozlowski LP. Proteome-pI 2.0: Proteome Isoelectric Point Database Update. Nucleic Acids Res. 2021, doi: 10.1093/nar/gkab944 | Contact: Lukasz P. Kozlowski |