Buchnera aphidicola subsp. Cinara cedri (strain Cc)
Taxonomy: cellular organisms; Bacteria; Proteobacteria; Gammaproteobacteria; Enterobacterales; Erwiniaceae; Buchnera; Buchnera aphidicola; Buchnera aphidicola (Cinara cedri)
Average proteome isoelectric point is 8.86
Get precalculated fractions of proteins
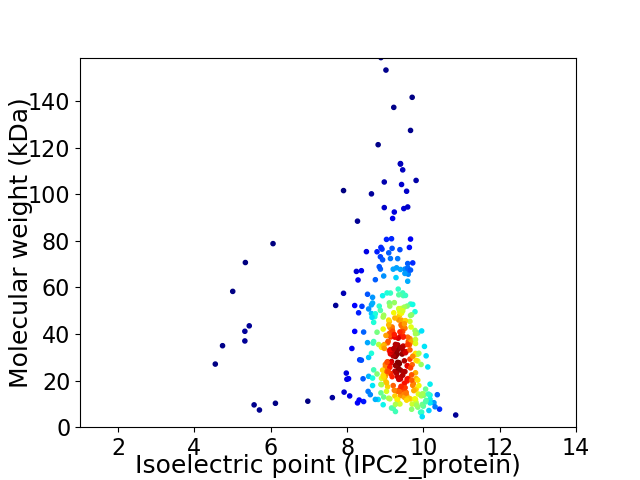
Virtual 2D-PAGE plot for 362 proteins (isoelectric point calculated using IPC2_protein)
Get csv file with sequences according to given criteria:
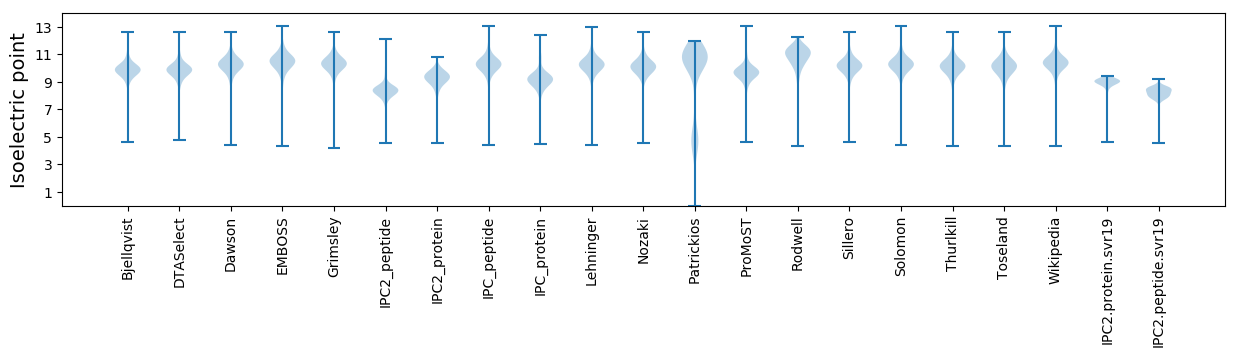
* You can choose from 21 different methods for calculating isoelectric point
Summary statistics related to proteome-wise predictions
Protein with the lowest isoelectric point:
>sp|Q057M1|RSMC_BUCCC Ribosomal RNA small subunit methyltransferase C OS=Buchnera aphidicola subsp. Cinara cedri (strain Cc) OX=372461 GN=rsmC PE=3 SV=1
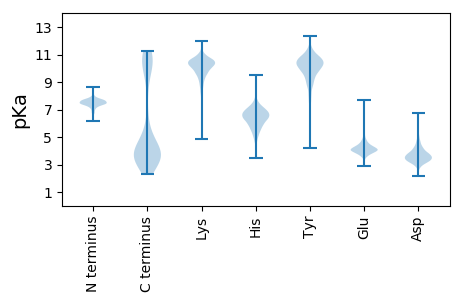
MM1 pKa = 7.35NNIINSIITLDD12 pKa = 3.64DD13 pKa = 3.79RR14 pKa = 11.84NLISKK19 pKa = 7.48EE20 pKa = 4.05TIINQDD26 pKa = 2.9YY27 pKa = 11.5DD28 pKa = 4.07NIDD31 pKa = 3.25TEE33 pKa = 4.92FYY35 pKa = 10.79KK36 pKa = 10.63KK37 pKa = 10.24YY38 pKa = 10.64AYY40 pKa = 10.28NIQTNSSDD48 pKa = 4.16DD49 pKa = 3.5QITNKK54 pKa = 10.34KK55 pKa = 9.65IVDD58 pKa = 3.63INSDD62 pKa = 4.18DD63 pKa = 3.9NSSLQSYY70 pKa = 9.87SNSSIDD76 pKa = 3.62EE77 pKa = 4.16DD78 pKa = 4.76TEE80 pKa = 4.47TGWFSVFDD88 pKa = 4.25DD89 pKa = 4.42DD90 pKa = 5.72GYY92 pKa = 11.48EE93 pKa = 3.98GFLRR97 pKa = 11.84EE98 pKa = 3.61GHH100 pKa = 6.07IAINEE105 pKa = 3.79NRR107 pKa = 11.84EE108 pKa = 3.98LCMNNYY114 pKa = 8.34TLLNTDD120 pKa = 4.04EE121 pKa = 4.88KK122 pKa = 11.01PIIVPEE128 pKa = 4.02NKK130 pKa = 10.01KK131 pKa = 10.14ILIKK135 pKa = 9.88MDD137 pKa = 3.06GTIVTKK143 pKa = 10.61EE144 pKa = 3.91DD145 pKa = 3.48NNEE148 pKa = 3.67INYY151 pKa = 9.81KK152 pKa = 10.36PIFLGQLKK160 pKa = 10.58FITLNNNDD168 pKa = 3.52VISRR172 pKa = 11.84NEE174 pKa = 3.76SEE176 pKa = 5.32IFDD179 pKa = 4.08LSYY182 pKa = 11.42SGLEE186 pKa = 3.83KK187 pKa = 10.96YY188 pKa = 10.53KK189 pKa = 11.18NNNLEE194 pKa = 4.17TKK196 pKa = 10.45SNYY199 pKa = 8.06VLKK202 pKa = 9.8NTIRR206 pKa = 11.84KK207 pKa = 9.21NDD209 pKa = 3.18IKK211 pKa = 10.56KK212 pKa = 8.92TNNLINTLNVIRR224 pKa = 11.84SLEE227 pKa = 3.89SDD229 pKa = 3.36MKK231 pKa = 10.97INSS234 pKa = 3.43
MM1 pKa = 7.35NNIINSIITLDD12 pKa = 3.64DD13 pKa = 3.79RR14 pKa = 11.84NLISKK19 pKa = 7.48EE20 pKa = 4.05TIINQDD26 pKa = 2.9YY27 pKa = 11.5DD28 pKa = 4.07NIDD31 pKa = 3.25TEE33 pKa = 4.92FYY35 pKa = 10.79KK36 pKa = 10.63KK37 pKa = 10.24YY38 pKa = 10.64AYY40 pKa = 10.28NIQTNSSDD48 pKa = 4.16DD49 pKa = 3.5QITNKK54 pKa = 10.34KK55 pKa = 9.65IVDD58 pKa = 3.63INSDD62 pKa = 4.18DD63 pKa = 3.9NSSLQSYY70 pKa = 9.87SNSSIDD76 pKa = 3.62EE77 pKa = 4.16DD78 pKa = 4.76TEE80 pKa = 4.47TGWFSVFDD88 pKa = 4.25DD89 pKa = 4.42DD90 pKa = 5.72GYY92 pKa = 11.48EE93 pKa = 3.98GFLRR97 pKa = 11.84EE98 pKa = 3.61GHH100 pKa = 6.07IAINEE105 pKa = 3.79NRR107 pKa = 11.84EE108 pKa = 3.98LCMNNYY114 pKa = 8.34TLLNTDD120 pKa = 4.04EE121 pKa = 4.88KK122 pKa = 11.01PIIVPEE128 pKa = 4.02NKK130 pKa = 10.01KK131 pKa = 10.14ILIKK135 pKa = 9.88MDD137 pKa = 3.06GTIVTKK143 pKa = 10.61EE144 pKa = 3.91DD145 pKa = 3.48NNEE148 pKa = 3.67INYY151 pKa = 9.81KK152 pKa = 10.36PIFLGQLKK160 pKa = 10.58FITLNNNDD168 pKa = 3.52VISRR172 pKa = 11.84NEE174 pKa = 3.76SEE176 pKa = 5.32IFDD179 pKa = 4.08LSYY182 pKa = 11.42SGLEE186 pKa = 3.83KK187 pKa = 10.96YY188 pKa = 10.53KK189 pKa = 11.18NNNLEE194 pKa = 4.17TKK196 pKa = 10.45SNYY199 pKa = 8.06VLKK202 pKa = 9.8NTIRR206 pKa = 11.84KK207 pKa = 9.21NDD209 pKa = 3.18IKK211 pKa = 10.56KK212 pKa = 8.92TNNLINTLNVIRR224 pKa = 11.84SLEE227 pKa = 3.89SDD229 pKa = 3.36MKK231 pKa = 10.97INSS234 pKa = 3.43
Molecular weight: 27.09 kDa
Isoelectric point according different methods:
Protein with the highest isoelectric point:
>sp|Q058F9|DNAA_BUCCC Chromosomal replication initiator protein DnaA OS=Buchnera aphidicola subsp. Cinara cedri (strain Cc) OX=372461 GN=dnaA PE=3 SV=1
MM1 pKa = 7.45KK2 pKa = 9.61RR3 pKa = 11.84TFQPSNIRR11 pKa = 11.84RR12 pKa = 11.84NRR14 pKa = 11.84THH16 pKa = 7.02GFRR19 pKa = 11.84ARR21 pKa = 11.84MSSKK25 pKa = 10.0SGRR28 pKa = 11.84NIISHH33 pKa = 6.31RR34 pKa = 11.84RR35 pKa = 11.84SKK37 pKa = 10.64LRR39 pKa = 11.84SVLCVV44 pKa = 3.07
MM1 pKa = 7.45KK2 pKa = 9.61RR3 pKa = 11.84TFQPSNIRR11 pKa = 11.84RR12 pKa = 11.84NRR14 pKa = 11.84THH16 pKa = 7.02GFRR19 pKa = 11.84ARR21 pKa = 11.84MSSKK25 pKa = 10.0SGRR28 pKa = 11.84NIISHH33 pKa = 6.31RR34 pKa = 11.84RR35 pKa = 11.84SKK37 pKa = 10.64LRR39 pKa = 11.84SVLCVV44 pKa = 3.07
Molecular weight: 5.23 kDa
Isoelectric point according different methods:
Peptides (in silico digests for buttom-up proteomics)
Below you can find in silico digests of the whole proteome with Trypsin, Chymotrypsin, Trypsin+LysC, LysN, ArgC proteases suitable for different mass spec machines.| Try ESI |
 |
|---|
| ChTry ESI |
|
|---|
| ArgC ESI |
|
|---|
| LysN ESI |
|
|---|
| TryLysC ESI |
|
|---|
| Try MALDI |
|
|---|
| ChTry MALDI |
|
|---|
| ArgC MALDI |
|
|---|
| LysN MALDI |
|
|---|
| TryLysC MALDI |
|
|---|
| Try LTQ |
|
|---|
| ChTry LTQ |
|
|---|
| ArgC LTQ |
|
|---|
| LysN LTQ |
|
|---|
| TryLysC LTQ |
|
|---|
| Try MSlow |
|
|---|
| ChTry MSlow |
|
|---|
| ArgC MSlow |
|
|---|
| LysN MSlow |
|
|---|
| TryLysC MSlow |
|
|---|
| Try MShigh |
|
|---|
| ChTry MShigh |
|
|---|
| ArgC MShigh |
|
|---|
| LysN MShigh |
|
|---|
| TryLysC MShigh |
|
|---|
General Statistics
Number of major isoforms |
Number of additional isoforms |
Number of all proteins |
Number of amino acids |
Min. Seq. Length |
Max. Seq. Length |
Avg. Seq. Length |
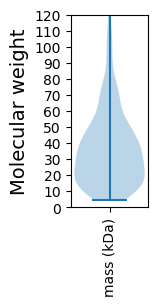
Avg. Mol. Weight |
|---|---|---|---|---|---|---|---|
0 |
119513 |
38 |
1410 |
330.1 |
38.25 |
Amino acid frequency
Ala |
Cys |
Asp |
Glu |
Phe |
Gly |
His |
Ile |
Lys |
Leu |
|---|---|---|---|---|---|---|---|---|---|
3.339 ± 0.119 | 1.279 ± 0.046 |
3.568 ± 0.085 | 4.266 ± 0.115 |
5.811 ± 0.178 | 4.794 ± 0.115 |
1.82 ± 0.043 | 13.394 ± 0.18 |
13.59 ± 0.294 | 9.636 ± 0.109 |
Met |
Asn |
Gln |
Pro |
Arg |
Ser |
Thr |
Val |
Trp |
Tyr |
|---|---|---|---|---|---|---|---|---|---|
1.859 ± 0.046 | 8.118 ± 0.126 |
2.681 ± 0.063 | 2.7 ± 0.056 |
3.199 ± 0.108 | 6.943 ± 0.089 |
4.092 ± 0.081 | 3.79 ± 0.11 |
0.817 ± 0.046 | 4.304 ± 0.096 |
Most of the basic statistics you can see at this page can be downloaded from this CSV file
See this proteome in:

Proteome-pI is available under Creative Commons Attribution-NoDerivs license, for more details see here
| Reference: Kozlowski LP. Proteome-pI 2.0: Proteome Isoelectric Point Database Update. Nucleic Acids Res. 2021, doi: 10.1093/nar/gkab944 | Contact: Lukasz P. Kozlowski |