Edaphobacter aggregans
Taxonomy: cellular organisms; Bacteria; Acidobacteria; Acidobacteriia; Acidobacteriales; Acidobacteriaceae; Edaphobacter
Average proteome isoelectric point is 6.7
Get precalculated fractions of proteins
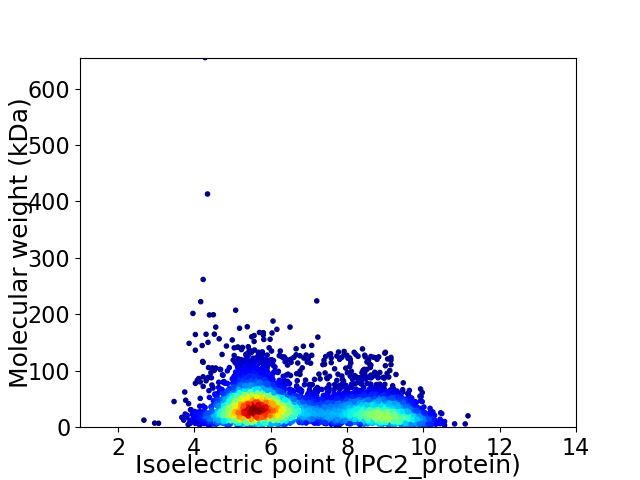
Virtual 2D-PAGE plot for 4941 proteins (isoelectric point calculated using IPC2_protein)
Get csv file with sequences according to given criteria:
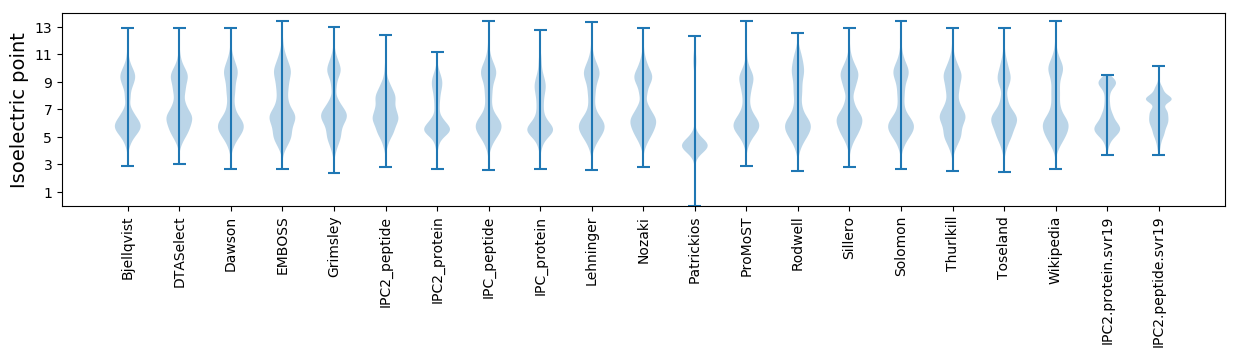
* You can choose from 21 different methods for calculating isoelectric point
Summary statistics related to proteome-wise predictions
Protein with the lowest isoelectric point:
>tr|A0A428MMJ2|A0A428MMJ2_9BACT 30S ribosomal protein S12 OS=Edaphobacter aggregans OX=570835 GN=rpsL PE=3 SV=1
MM1 pKa = 7.57AAQAPSRR8 pKa = 11.84WILLALLGLAGTLTTQTAMADD29 pKa = 3.29SFTFAFSGGGISASGIITVSPTATPGTDD57 pKa = 3.21TITGISGFFSDD68 pKa = 4.64TNASANFSGAITGLEE83 pKa = 4.07FAPPPSSPPPFPAPAFTASGFSYY106 pKa = 11.4DD107 pKa = 3.45NLFYY111 pKa = 10.75TDD113 pKa = 3.73GNSPLVCPPEE123 pKa = 4.5TPGGPPGYY131 pKa = 9.1PFAGGFLDD139 pKa = 3.51IYY141 pKa = 11.2GVAFDD146 pKa = 3.74VAGGYY151 pKa = 7.7TVDD154 pKa = 3.11LWSNGVVPEE163 pKa = 4.5AGLTYY168 pKa = 10.12EE169 pKa = 4.2VSDD172 pKa = 4.14AFGTTLLEE180 pKa = 4.61PDD182 pKa = 4.09NEE184 pKa = 4.41GQAVPVSLSTSPIPEE199 pKa = 4.88PGSLLLMGTGLFGLVDD215 pKa = 3.24VLRR218 pKa = 11.84RR219 pKa = 11.84RR220 pKa = 11.84SKK222 pKa = 10.75HH223 pKa = 5.71SLGFDD228 pKa = 3.08AA229 pKa = 6.42
MM1 pKa = 7.57AAQAPSRR8 pKa = 11.84WILLALLGLAGTLTTQTAMADD29 pKa = 3.29SFTFAFSGGGISASGIITVSPTATPGTDD57 pKa = 3.21TITGISGFFSDD68 pKa = 4.64TNASANFSGAITGLEE83 pKa = 4.07FAPPPSSPPPFPAPAFTASGFSYY106 pKa = 11.4DD107 pKa = 3.45NLFYY111 pKa = 10.75TDD113 pKa = 3.73GNSPLVCPPEE123 pKa = 4.5TPGGPPGYY131 pKa = 9.1PFAGGFLDD139 pKa = 3.51IYY141 pKa = 11.2GVAFDD146 pKa = 3.74VAGGYY151 pKa = 7.7TVDD154 pKa = 3.11LWSNGVVPEE163 pKa = 4.5AGLTYY168 pKa = 10.12EE169 pKa = 4.2VSDD172 pKa = 4.14AFGTTLLEE180 pKa = 4.61PDD182 pKa = 4.09NEE184 pKa = 4.41GQAVPVSLSTSPIPEE199 pKa = 4.88PGSLLLMGTGLFGLVDD215 pKa = 3.24VLRR218 pKa = 11.84RR219 pKa = 11.84RR220 pKa = 11.84SKK222 pKa = 10.75HH223 pKa = 5.71SLGFDD228 pKa = 3.08AA229 pKa = 6.42
Molecular weight: 23.29 kDa
Isoelectric point according different methods:
Protein with the highest isoelectric point:
>tr|A0A3R9PUH0|A0A3R9PUH0_9BACT Uncharacterized protein DUF4231 OS=Edaphobacter aggregans OX=570835 GN=EDE15_3704 PE=4 SV=1
MM1 pKa = 7.51PAPRR5 pKa = 11.84RR6 pKa = 11.84LLLLPPHH13 pKa = 6.94HH14 pKa = 7.29PPPSPGPAQPPSPHH28 pKa = 6.56RR29 pKa = 11.84PLRR32 pKa = 11.84PPHH35 pKa = 5.97ARR37 pKa = 11.84RR38 pKa = 11.84PRR40 pKa = 11.84RR41 pKa = 11.84HH42 pKa = 5.64PTLHH46 pKa = 6.39RR47 pKa = 11.84RR48 pKa = 11.84NPPPHH53 pKa = 6.92RR54 pKa = 11.84PQRR57 pKa = 11.84DD58 pKa = 3.25RR59 pKa = 11.84PPPRR63 pKa = 11.84RR64 pKa = 11.84PPPLRR69 pKa = 11.84PANRR73 pKa = 11.84QHH75 pKa = 6.31QPTPRR80 pKa = 11.84PQTHH84 pKa = 6.77PQHH87 pKa = 6.28QSPLRR92 pKa = 11.84TPSHH96 pKa = 5.5LHH98 pKa = 5.9RR99 pKa = 11.84RR100 pKa = 11.84HH101 pKa = 5.25HH102 pKa = 5.88HH103 pKa = 6.27RR104 pKa = 11.84PRR106 pKa = 11.84ARR108 pKa = 11.84PPRR111 pKa = 11.84SSIRR115 pKa = 11.84VRR117 pKa = 11.84PGHH120 pKa = 6.21RR121 pKa = 11.84RR122 pKa = 11.84RR123 pKa = 11.84PPQEE127 pKa = 3.42HH128 pKa = 6.82HH129 pKa = 7.08APTPRR134 pKa = 11.84PVRR137 pKa = 11.84PRR139 pKa = 11.84PTHH142 pKa = 6.3PRR144 pKa = 11.84TQTRR148 pKa = 11.84NPPHH152 pKa = 6.8PPSHH156 pKa = 6.28RR157 pKa = 11.84RR158 pKa = 11.84KK159 pKa = 7.58PTNIGVIRR167 pKa = 11.84ANRR170 pKa = 11.84CC171 pKa = 2.93
MM1 pKa = 7.51PAPRR5 pKa = 11.84RR6 pKa = 11.84LLLLPPHH13 pKa = 6.94HH14 pKa = 7.29PPPSPGPAQPPSPHH28 pKa = 6.56RR29 pKa = 11.84PLRR32 pKa = 11.84PPHH35 pKa = 5.97ARR37 pKa = 11.84RR38 pKa = 11.84PRR40 pKa = 11.84RR41 pKa = 11.84HH42 pKa = 5.64PTLHH46 pKa = 6.39RR47 pKa = 11.84RR48 pKa = 11.84NPPPHH53 pKa = 6.92RR54 pKa = 11.84PQRR57 pKa = 11.84DD58 pKa = 3.25RR59 pKa = 11.84PPPRR63 pKa = 11.84RR64 pKa = 11.84PPPLRR69 pKa = 11.84PANRR73 pKa = 11.84QHH75 pKa = 6.31QPTPRR80 pKa = 11.84PQTHH84 pKa = 6.77PQHH87 pKa = 6.28QSPLRR92 pKa = 11.84TPSHH96 pKa = 5.5LHH98 pKa = 5.9RR99 pKa = 11.84RR100 pKa = 11.84HH101 pKa = 5.25HH102 pKa = 5.88HH103 pKa = 6.27RR104 pKa = 11.84PRR106 pKa = 11.84ARR108 pKa = 11.84PPRR111 pKa = 11.84SSIRR115 pKa = 11.84VRR117 pKa = 11.84PGHH120 pKa = 6.21RR121 pKa = 11.84RR122 pKa = 11.84RR123 pKa = 11.84PPQEE127 pKa = 3.42HH128 pKa = 6.82HH129 pKa = 7.08APTPRR134 pKa = 11.84PVRR137 pKa = 11.84PRR139 pKa = 11.84PTHH142 pKa = 6.3PRR144 pKa = 11.84TQTRR148 pKa = 11.84NPPHH152 pKa = 6.8PPSHH156 pKa = 6.28RR157 pKa = 11.84RR158 pKa = 11.84KK159 pKa = 7.58PTNIGVIRR167 pKa = 11.84ANRR170 pKa = 11.84CC171 pKa = 2.93
Molecular weight: 20.12 kDa
Isoelectric point according different methods:
Peptides (in silico digests for buttom-up proteomics)
Below you can find in silico digests of the whole proteome with Trypsin, Chymotrypsin, Trypsin+LysC, LysN, ArgC proteases suitable for different mass spec machines.| Try ESI |
 |
|---|
| ChTry ESI |
|
|---|
| ArgC ESI |
|
|---|
| LysN ESI |
|
|---|
| TryLysC ESI |
|
|---|
| Try MALDI |
|
|---|
| ChTry MALDI |
|
|---|
| ArgC MALDI |
|
|---|
| LysN MALDI |
|
|---|
| TryLysC MALDI |
|
|---|
| Try LTQ |
|
|---|
| ChTry LTQ |
|
|---|
| ArgC LTQ |
|
|---|
| LysN LTQ |
|
|---|
| TryLysC LTQ |
|
|---|
| Try MSlow |
|
|---|
| ChTry MSlow |
|
|---|
| ArgC MSlow |
|
|---|
| LysN MSlow |
|
|---|
| TryLysC MSlow |
|
|---|
| Try MShigh |
|
|---|
| ChTry MShigh |
|
|---|
| ArgC MShigh |
|
|---|
| LysN MShigh |
|
|---|
| TryLysC MShigh |
|
|---|
General Statistics
Number of major isoforms |
Number of additional isoforms |
Number of all proteins |
Number of amino acids |
Min. Seq. Length |
Max. Seq. Length |
Avg. Seq. Length |
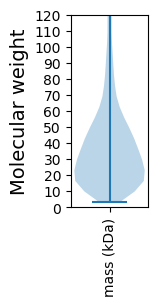
Avg. Mol. Weight |
|---|---|---|---|---|---|---|---|
0 |
1776201 |
29 |
6628 |
359.5 |
39.23 |
Amino acid frequency
Ala |
Cys |
Asp |
Glu |
Phe |
Gly |
His |
Ile |
Lys |
Leu |
|---|---|---|---|---|---|---|---|---|---|
10.569 ± 0.047 | 0.861 ± 0.011 |
5.038 ± 0.028 | 5.138 ± 0.045 |
3.971 ± 0.028 | 7.981 ± 0.04 |
2.211 ± 0.018 | 5.191 ± 0.027 |
3.707 ± 0.032 | 9.815 ± 0.049 |
Met |
Asn |
Gln |
Pro |
Arg |
Ser |
Thr |
Val |
Trp |
Tyr |
|---|---|---|---|---|---|---|---|---|---|
2.214 ± 0.019 | 3.639 ± 0.041 |
5.461 ± 0.028 | 3.888 ± 0.026 |
5.885 ± 0.048 | 6.508 ± 0.036 |
6.527 ± 0.073 | 7.242 ± 0.035 |
1.384 ± 0.017 | 2.769 ± 0.021 |
Most of the basic statistics you can see at this page can be downloaded from this CSV file
See this proteome in:

Proteome-pI is available under Creative Commons Attribution-NoDerivs license, for more details see here
| Reference: Kozlowski LP. Proteome-pI 2.0: Proteome Isoelectric Point Database Update. Nucleic Acids Res. 2021, doi: 10.1093/nar/gkab944 | Contact: Lukasz P. Kozlowski |