Acetobacter orientalis
Taxonomy: cellular organisms; Bacteria; Proteobacteria; Alphaproteobacteria; Rhodospirillales; Acetobacteraceae; Acetobacter
Average proteome isoelectric point is 6.78
Get precalculated fractions of proteins
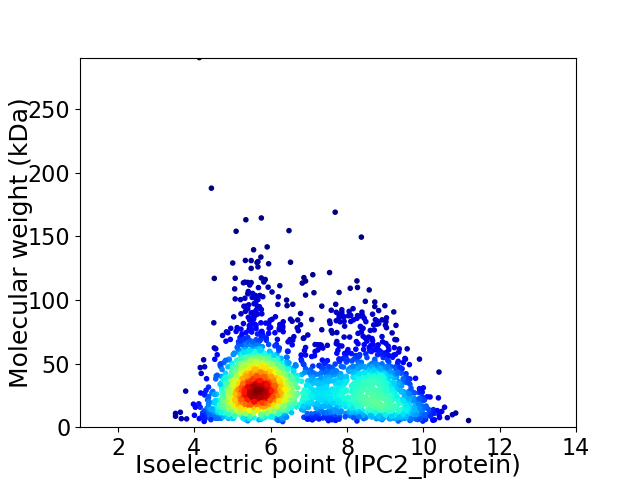
Virtual 2D-PAGE plot for 2561 proteins (isoelectric point calculated using IPC2_protein)
Get csv file with sequences according to given criteria:
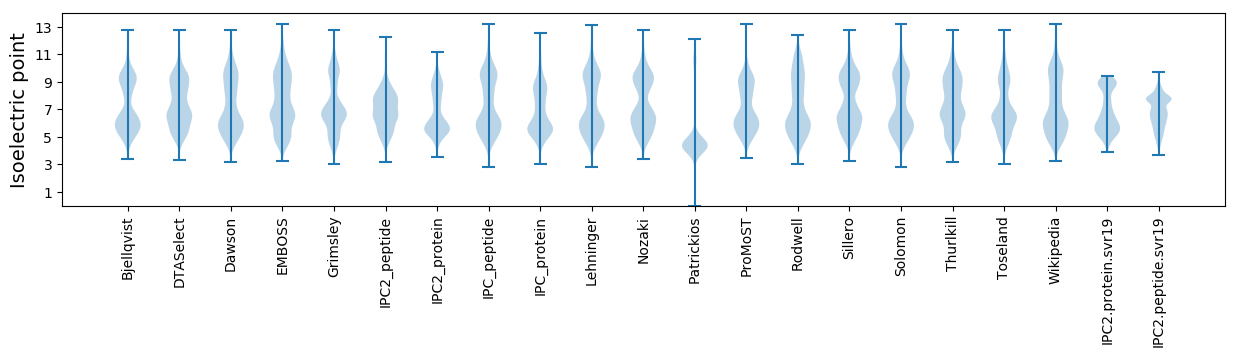
* You can choose from 21 different methods for calculating isoelectric point
Summary statistics related to proteome-wise predictions
Protein with the lowest isoelectric point:
>tr|A0A2Z5ZEC6|A0A2Z5ZEC6_9PROT Flagellar protein flbB OS=Acetobacter orientalis OX=146474 GN=Abor_017_092 PE=4 SV=1
MM1 pKa = 7.41SVFNAISTAVSGINAQSTAFSNLSNNIANSQTVGYY36 pKa = 9.35KK37 pKa = 10.06ADD39 pKa = 3.41STAFQDD45 pKa = 4.33FVSGQLINSSRR56 pKa = 11.84NEE58 pKa = 3.95GNSDD62 pKa = 3.09SVAAVTIQHH71 pKa = 5.95VDD73 pKa = 3.08KK74 pKa = 11.22QGTATVSNDD83 pKa = 3.2SLAMSIDD90 pKa = 3.2GSGLFNVTKK99 pKa = 10.54SPSDD103 pKa = 3.56TSSSASLNQTRR114 pKa = 11.84YY115 pKa = 5.18YY116 pKa = 9.04TRR118 pKa = 11.84NGEE121 pKa = 4.08FYY123 pKa = 10.34EE124 pKa = 4.51DD125 pKa = 3.41KK126 pKa = 10.97NGYY129 pKa = 8.78LVNTSGYY136 pKa = 8.53YY137 pKa = 9.71LSGYY141 pKa = 9.82KK142 pKa = 8.73VTDD145 pKa = 3.3QSTGTLSNQLTSVNVANVQYY165 pKa = 11.07SPISNPTISVKK176 pKa = 10.67GYY178 pKa = 9.78VGSSVDD184 pKa = 3.48KK185 pKa = 8.76TTSTATNSQTTTIYY199 pKa = 10.98DD200 pKa = 3.98SNNDD204 pKa = 3.17AHH206 pKa = 6.47NVKK209 pKa = 10.35LDD211 pKa = 3.22WSYY214 pKa = 12.09VSDD217 pKa = 3.51STTTNNLQTWKK228 pKa = 10.38LDD230 pKa = 3.18VSTPDD235 pKa = 3.41TNSSVSGTYY244 pKa = 9.53YY245 pKa = 10.72VQFDD249 pKa = 4.03STTGAIQTVSKK260 pKa = 11.19SEE262 pKa = 4.48DD263 pKa = 3.42GTNSLISTTNSSIPLTFNYY282 pKa = 9.84TDD284 pKa = 4.29LQSQSASMPFQLNLGLQGSTSGATLSSSTGPVITTPTTDD323 pKa = 3.24SKK325 pKa = 11.6SSSQVGSYY333 pKa = 9.72TGVEE337 pKa = 3.99IQSDD341 pKa = 4.16GTIMAKK347 pKa = 10.74FSLGDD352 pKa = 3.43TQAIGQVALTNFASVNNLQEE372 pKa = 4.19VSGQAYY378 pKa = 9.84LATPSAGTPQTGLVGEE394 pKa = 4.68NGTGSLTVGYY404 pKa = 8.3TEE406 pKa = 5.81SSTTDD411 pKa = 3.28LTSDD415 pKa = 3.83LSALIIAQQAYY426 pKa = 6.15TANTKK431 pKa = 9.89IVTTASEE438 pKa = 4.17LLQTTIAMKK447 pKa = 10.31QQ448 pKa = 3.01
MM1 pKa = 7.41SVFNAISTAVSGINAQSTAFSNLSNNIANSQTVGYY36 pKa = 9.35KK37 pKa = 10.06ADD39 pKa = 3.41STAFQDD45 pKa = 4.33FVSGQLINSSRR56 pKa = 11.84NEE58 pKa = 3.95GNSDD62 pKa = 3.09SVAAVTIQHH71 pKa = 5.95VDD73 pKa = 3.08KK74 pKa = 11.22QGTATVSNDD83 pKa = 3.2SLAMSIDD90 pKa = 3.2GSGLFNVTKK99 pKa = 10.54SPSDD103 pKa = 3.56TSSSASLNQTRR114 pKa = 11.84YY115 pKa = 5.18YY116 pKa = 9.04TRR118 pKa = 11.84NGEE121 pKa = 4.08FYY123 pKa = 10.34EE124 pKa = 4.51DD125 pKa = 3.41KK126 pKa = 10.97NGYY129 pKa = 8.78LVNTSGYY136 pKa = 8.53YY137 pKa = 9.71LSGYY141 pKa = 9.82KK142 pKa = 8.73VTDD145 pKa = 3.3QSTGTLSNQLTSVNVANVQYY165 pKa = 11.07SPISNPTISVKK176 pKa = 10.67GYY178 pKa = 9.78VGSSVDD184 pKa = 3.48KK185 pKa = 8.76TTSTATNSQTTTIYY199 pKa = 10.98DD200 pKa = 3.98SNNDD204 pKa = 3.17AHH206 pKa = 6.47NVKK209 pKa = 10.35LDD211 pKa = 3.22WSYY214 pKa = 12.09VSDD217 pKa = 3.51STTTNNLQTWKK228 pKa = 10.38LDD230 pKa = 3.18VSTPDD235 pKa = 3.41TNSSVSGTYY244 pKa = 9.53YY245 pKa = 10.72VQFDD249 pKa = 4.03STTGAIQTVSKK260 pKa = 11.19SEE262 pKa = 4.48DD263 pKa = 3.42GTNSLISTTNSSIPLTFNYY282 pKa = 9.84TDD284 pKa = 4.29LQSQSASMPFQLNLGLQGSTSGATLSSSTGPVITTPTTDD323 pKa = 3.24SKK325 pKa = 11.6SSSQVGSYY333 pKa = 9.72TGVEE337 pKa = 3.99IQSDD341 pKa = 4.16GTIMAKK347 pKa = 10.74FSLGDD352 pKa = 3.43TQAIGQVALTNFASVNNLQEE372 pKa = 4.19VSGQAYY378 pKa = 9.84LATPSAGTPQTGLVGEE394 pKa = 4.68NGTGSLTVGYY404 pKa = 8.3TEE406 pKa = 5.81SSTTDD411 pKa = 3.28LTSDD415 pKa = 3.83LSALIIAQQAYY426 pKa = 6.15TANTKK431 pKa = 9.89IVTTASEE438 pKa = 4.17LLQTTIAMKK447 pKa = 10.31QQ448 pKa = 3.01
Molecular weight: 46.84 kDa
Isoelectric point according different methods:
Protein with the highest isoelectric point:
>tr|A0A252BCH2|A0A252BCH2_9PROT Magnesium transporter OS=Acetobacter orientalis OX=146474 GN=Abor_065_093 PE=3 SV=1
MM1 pKa = 7.35KK2 pKa = 9.4RR3 pKa = 11.84TYY5 pKa = 10.2QPSRR9 pKa = 11.84LVRR12 pKa = 11.84KK13 pKa = 9.21RR14 pKa = 11.84RR15 pKa = 11.84HH16 pKa = 4.48GFRR19 pKa = 11.84ARR21 pKa = 11.84MATVGGRR28 pKa = 11.84RR29 pKa = 11.84IIANRR34 pKa = 11.84RR35 pKa = 11.84SKK37 pKa = 10.47GRR39 pKa = 11.84KK40 pKa = 8.72RR41 pKa = 11.84LSAA44 pKa = 3.96
MM1 pKa = 7.35KK2 pKa = 9.4RR3 pKa = 11.84TYY5 pKa = 10.2QPSRR9 pKa = 11.84LVRR12 pKa = 11.84KK13 pKa = 9.21RR14 pKa = 11.84RR15 pKa = 11.84HH16 pKa = 4.48GFRR19 pKa = 11.84ARR21 pKa = 11.84MATVGGRR28 pKa = 11.84RR29 pKa = 11.84IIANRR34 pKa = 11.84RR35 pKa = 11.84SKK37 pKa = 10.47GRR39 pKa = 11.84KK40 pKa = 8.72RR41 pKa = 11.84LSAA44 pKa = 3.96
Molecular weight: 5.24 kDa
Isoelectric point according different methods:
Peptides (in silico digests for buttom-up proteomics)
Below you can find in silico digests of the whole proteome with Trypsin, Chymotrypsin, Trypsin+LysC, LysN, ArgC proteases suitable for different mass spec machines.| Try ESI |
 |
|---|
| ChTry ESI |
|
|---|
| ArgC ESI |
|
|---|
| LysN ESI |
|
|---|
| TryLysC ESI |
|
|---|
| Try MALDI |
|
|---|
| ChTry MALDI |
|
|---|
| ArgC MALDI |
|
|---|
| LysN MALDI |
|
|---|
| TryLysC MALDI |
|
|---|
| Try LTQ |
|
|---|
| ChTry LTQ |
|
|---|
| ArgC LTQ |
|
|---|
| LysN LTQ |
|
|---|
| TryLysC LTQ |
|
|---|
| Try MSlow |
|
|---|
| ChTry MSlow |
|
|---|
| ArgC MSlow |
|
|---|
| LysN MSlow |
|
|---|
| TryLysC MSlow |
|
|---|
| Try MShigh |
|
|---|
| ChTry MShigh |
|
|---|
| ArgC MShigh |
|
|---|
| LysN MShigh |
|
|---|
| TryLysC MShigh |
|
|---|
General Statistics
Number of major isoforms |
Number of additional isoforms |
Number of all proteins |
Number of amino acids |
Min. Seq. Length |
Max. Seq. Length |
Avg. Seq. Length |
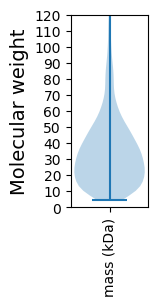
Avg. Mol. Weight |
|---|---|---|---|---|---|---|---|
0 |
843554 |
42 |
3141 |
329.4 |
35.74 |
Amino acid frequency
Ala |
Cys |
Asp |
Glu |
Phe |
Gly |
His |
Ile |
Lys |
Leu |
|---|---|---|---|---|---|---|---|---|---|
11.834 ± 0.068 | 1.028 ± 0.016 |
4.872 ± 0.035 | 5.03 ± 0.051 |
3.593 ± 0.032 | 8.164 ± 0.1 |
2.487 ± 0.025 | 4.807 ± 0.036 |
3.558 ± 0.036 | 10.479 ± 0.061 |
Met |
Asn |
Gln |
Pro |
Arg |
Ser |
Thr |
Val |
Trp |
Tyr |
|---|---|---|---|---|---|---|---|---|---|
2.421 ± 0.025 | 3.1 ± 0.04 |
5.52 ± 0.047 | 4.177 ± 0.033 |
5.98 ± 0.051 | 5.731 ± 0.051 |
6.298 ± 0.037 | 7.159 ± 0.039 |
1.357 ± 0.02 | 2.406 ± 0.032 |
Most of the basic statistics you can see at this page can be downloaded from this CSV file
See this proteome in:

Proteome-pI is available under Creative Commons Attribution-NoDerivs license, for more details see here
| Reference: Kozlowski LP. Proteome-pI 2.0: Proteome Isoelectric Point Database Update. Nucleic Acids Res. 2021, doi: 10.1093/nar/gkab944 | Contact: Lukasz P. Kozlowski |