Lactococcus lactis phage P475
Taxonomy: Viruses; Duplodnaviria; Heunggongvirae; Uroviricota; Caudoviricetes; Caudovirales; Siphoviridae; Skunavirus; Lactococcus virus P475
Average proteome isoelectric point is 6.47
Get precalculated fractions of proteins
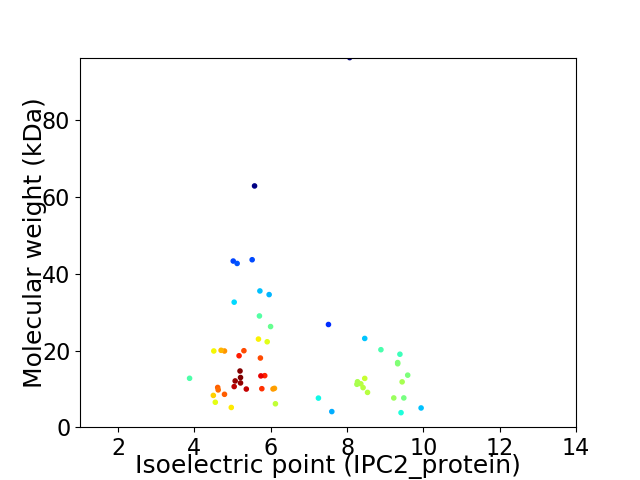
Virtual 2D-PAGE plot for 57 proteins (isoelectric point calculated using IPC2_protein)
Get csv file with sequences according to given criteria:
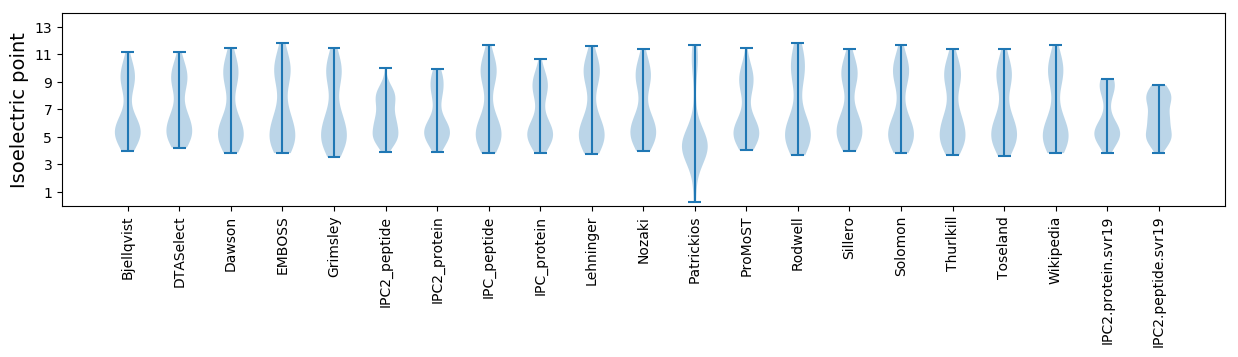
* You can choose from 21 different methods for calculating isoelectric point
Summary statistics related to proteome-wise predictions
Protein with the lowest isoelectric point:
>tr|R9R1P4|R9R1P4_9CAUD Uncharacterized protein OS=Lactococcus lactis phage P475 OX=213774 GN=P475_0015 PE=4 SV=1
MM1 pKa = 7.56EE2 pKa = 5.5FDD4 pKa = 6.13SYY6 pKa = 11.42IDD8 pKa = 3.32WYY10 pKa = 11.58NNLLTMPLNDD20 pKa = 3.86VILGVKK26 pKa = 8.96DD27 pKa = 3.57TIEE30 pKa = 4.55DD31 pKa = 3.52KK32 pKa = 10.66TVYY35 pKa = 10.62LSLSDD40 pKa = 3.95SKK42 pKa = 10.99VLKK45 pKa = 9.75MDD47 pKa = 3.09NTSFVMGYY55 pKa = 9.13YY56 pKa = 8.74YY57 pKa = 10.45QVVLSVKK64 pKa = 10.52DD65 pKa = 3.51VDD67 pKa = 4.41DD68 pKa = 4.44EE69 pKa = 4.52LVGLVGDD76 pKa = 4.15VLQNGWNMTNWSEE89 pKa = 4.32NSHH92 pKa = 6.58LYY94 pKa = 10.7NYY96 pKa = 8.61TGTVYY101 pKa = 10.45LPCGSGGQAWQQ112 pKa = 3.18
MM1 pKa = 7.56EE2 pKa = 5.5FDD4 pKa = 6.13SYY6 pKa = 11.42IDD8 pKa = 3.32WYY10 pKa = 11.58NNLLTMPLNDD20 pKa = 3.86VILGVKK26 pKa = 8.96DD27 pKa = 3.57TIEE30 pKa = 4.55DD31 pKa = 3.52KK32 pKa = 10.66TVYY35 pKa = 10.62LSLSDD40 pKa = 3.95SKK42 pKa = 10.99VLKK45 pKa = 9.75MDD47 pKa = 3.09NTSFVMGYY55 pKa = 9.13YY56 pKa = 8.74YY57 pKa = 10.45QVVLSVKK64 pKa = 10.52DD65 pKa = 3.51VDD67 pKa = 4.41DD68 pKa = 4.44EE69 pKa = 4.52LVGLVGDD76 pKa = 4.15VLQNGWNMTNWSEE89 pKa = 4.32NSHH92 pKa = 6.58LYY94 pKa = 10.7NYY96 pKa = 8.61TGTVYY101 pKa = 10.45LPCGSGGQAWQQ112 pKa = 3.18
Molecular weight: 12.75 kDa
Isoelectric point according different methods:
Protein with the highest isoelectric point:
>tr|R9R1N8|R9R1N8_9CAUD Putative prohead protease OS=Lactococcus lactis phage P475 OX=213774 GN=P475_005 PE=4 SV=1
MM1 pKa = 7.78IILLFIIMLFISPRR15 pKa = 11.84IALLILLLAINPVFVLLWLLVWLAIKK41 pKa = 10.62LKK43 pKa = 10.74
MM1 pKa = 7.78IILLFIIMLFISPRR15 pKa = 11.84IALLILLLAINPVFVLLWLLVWLAIKK41 pKa = 10.62LKK43 pKa = 10.74
Molecular weight: 5.02 kDa
Isoelectric point according different methods:
Peptides (in silico digests for buttom-up proteomics)
Below you can find in silico digests of the whole proteome with Trypsin, Chymotrypsin, Trypsin+LysC, LysN, ArgC proteases suitable for different mass spec machines.| Try ESI |
 |
|---|
| ChTry ESI |
|
|---|
| ArgC ESI |
|
|---|
| LysN ESI |
|
|---|
| TryLysC ESI |
|
|---|
| Try MALDI |
|
|---|
| ChTry MALDI |
|
|---|
| ArgC MALDI |
|
|---|
| LysN MALDI |
|
|---|
| TryLysC MALDI |
|
|---|
| Try LTQ |
|
|---|
| ChTry LTQ |
|
|---|
| ArgC LTQ |
|
|---|
| LysN LTQ |
|
|---|
| TryLysC LTQ |
|
|---|
| Try MSlow |
|
|---|
| ChTry MSlow |
|
|---|
| ArgC MSlow |
|
|---|
| LysN MSlow |
|
|---|
| TryLysC MSlow |
|
|---|
| Try MShigh |
|
|---|
| ChTry MShigh |
|
|---|
| ArgC MShigh |
|
|---|
| LysN MShigh |
|
|---|
| TryLysC MShigh |
|
|---|
General Statistics
Number of major isoforms |
Number of additional isoforms |
Number of all proteins |
Number of amino acids |
Min. Seq. Length |
Max. Seq. Length |
Avg. Seq. Length |
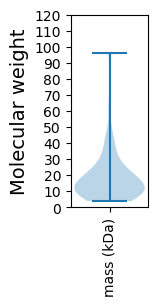
Avg. Mol. Weight |
|---|---|---|---|---|---|---|---|
0 |
9262 |
32 |
916 |
162.5 |
18.51 |
Amino acid frequency
Ala |
Cys |
Asp |
Glu |
Phe |
Gly |
His |
Ile |
Lys |
Leu |
|---|---|---|---|---|---|---|---|---|---|
6.143 ± 0.626 | 0.583 ± 0.141 |
5.841 ± 0.222 | 7.677 ± 0.56 |
4.276 ± 0.327 | 6.295 ± 0.616 |
1.296 ± 0.188 | 6.845 ± 0.273 |
9.577 ± 0.524 | 8.422 ± 0.404 |
Met |
Asn |
Gln |
Pro |
Arg |
Ser |
Thr |
Val |
Trp |
Tyr |
|---|---|---|---|---|---|---|---|---|---|
2.494 ± 0.133 | 6.672 ± 0.259 |
2.224 ± 0.256 | 3.649 ± 0.239 |
3.552 ± 0.284 | 6.187 ± 0.441 |
6.111 ± 0.28 | 6.305 ± 0.398 |
1.555 ± 0.147 | 4.297 ± 0.464 |
Most of the basic statistics you can see at this page can be downloaded from this CSV file
See this proteome in:

Proteome-pI is available under Creative Commons Attribution-NoDerivs license, for more details see here
| Reference: Kozlowski LP. Proteome-pI 2.0: Proteome Isoelectric Point Database Update. Nucleic Acids Res. 2021, doi: 10.1093/nar/gkab944 | Contact: Lukasz P. Kozlowski |