Micromonospora pisi
Taxonomy: cellular organisms; Bacteria; Terrabacteria group; Actinobacteria; Actinomycetia; Micromonosporales; Micromonosporaceae; Micromonospora
Average proteome isoelectric point is 6.45
Get precalculated fractions of proteins
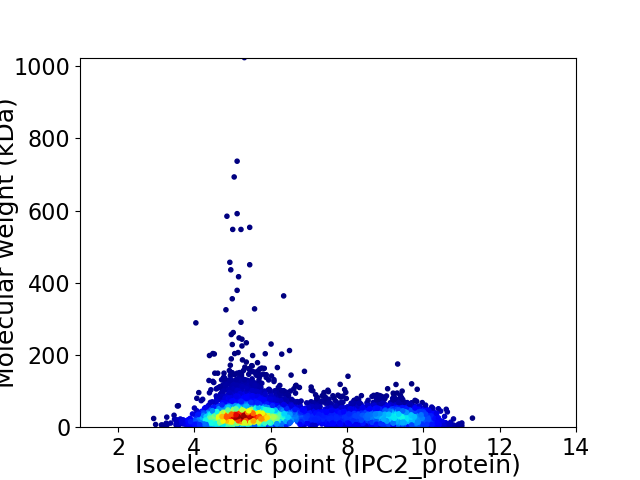
Virtual 2D-PAGE plot for 7409 proteins (isoelectric point calculated using IPC2_protein)
Get csv file with sequences according to given criteria:
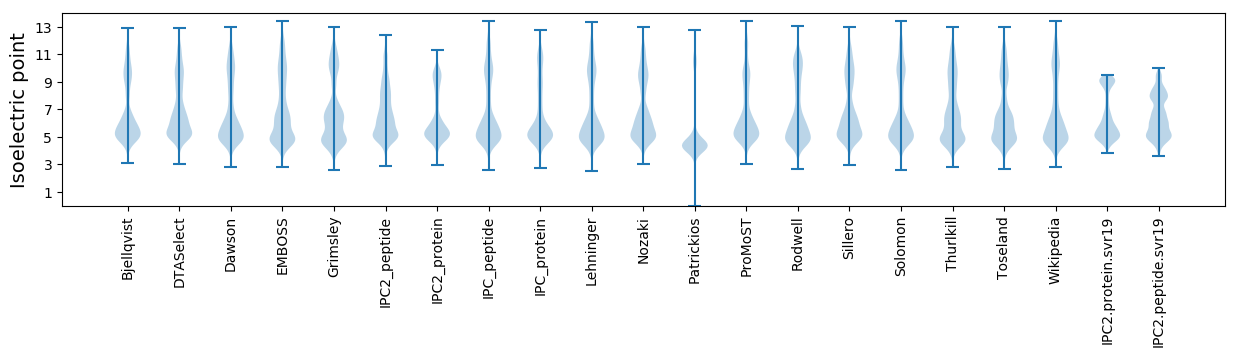
* You can choose from 21 different methods for calculating isoelectric point
Summary statistics related to proteome-wise predictions
Protein with the lowest isoelectric point:
>tr|A0A495JCA4|A0A495JCA4_9ACTN Uncharacterized protein OS=Micromonospora pisi OX=589240 GN=BDK92_0233 PE=4 SV=1
MM1 pKa = 7.19ATYY4 pKa = 10.17HH5 pKa = 6.23IQTEE9 pKa = 4.31DD10 pKa = 3.56MQEE13 pKa = 4.07SASWLQQNMQTLLDD27 pKa = 4.01GMNQAKK33 pKa = 10.44SKK35 pKa = 10.47IDD37 pKa = 3.31TLIQGGYY44 pKa = 6.94NTPAAQAKK52 pKa = 8.61FGPYY56 pKa = 8.82FDD58 pKa = 4.87EE59 pKa = 4.7YY60 pKa = 10.94KK61 pKa = 10.91SSVDD65 pKa = 3.17QTLQGMEE72 pKa = 5.08GISQYY77 pKa = 10.52LQQVGTAFEE86 pKa = 4.46DD87 pKa = 3.8TDD89 pKa = 3.95TQTGNSLGG97 pKa = 3.67
MM1 pKa = 7.19ATYY4 pKa = 10.17HH5 pKa = 6.23IQTEE9 pKa = 4.31DD10 pKa = 3.56MQEE13 pKa = 4.07SASWLQQNMQTLLDD27 pKa = 4.01GMNQAKK33 pKa = 10.44SKK35 pKa = 10.47IDD37 pKa = 3.31TLIQGGYY44 pKa = 6.94NTPAAQAKK52 pKa = 8.61FGPYY56 pKa = 8.82FDD58 pKa = 4.87EE59 pKa = 4.7YY60 pKa = 10.94KK61 pKa = 10.91SSVDD65 pKa = 3.17QTLQGMEE72 pKa = 5.08GISQYY77 pKa = 10.52LQQVGTAFEE86 pKa = 4.46DD87 pKa = 3.8TDD89 pKa = 3.95TQTGNSLGG97 pKa = 3.67
Molecular weight: 10.74 kDa
Isoelectric point according different methods:
Protein with the highest isoelectric point:
>tr|A0A495JGD3|A0A495JGD3_9ACTN Uncharacterized protein OS=Micromonospora pisi OX=589240 GN=BDK92_2156 PE=4 SV=1
MM1 pKa = 7.84AEE3 pKa = 4.06ALKK6 pKa = 9.74ATSRR10 pKa = 11.84PAAKK14 pKa = 8.96RR15 pKa = 11.84TGVKK19 pKa = 8.77KK20 pKa = 7.29TTAARR25 pKa = 11.84STTGAKK31 pKa = 7.71KK32 pKa = 8.88TPAARR37 pKa = 11.84KK38 pKa = 4.52TTAAAKK44 pKa = 8.78STTTAARR51 pKa = 11.84PTSTRR56 pKa = 11.84ATATRR61 pKa = 11.84PATAKK66 pKa = 9.05KK67 pKa = 7.95TAAKK71 pKa = 9.46KK72 pKa = 10.76APVKK76 pKa = 10.27KK77 pKa = 10.16AAAKK81 pKa = 6.59TTTAKK86 pKa = 9.32KK87 pKa = 8.54TVASKK92 pKa = 10.75AATARR97 pKa = 11.84KK98 pKa = 9.32KK99 pKa = 10.01ATTAATRR106 pKa = 11.84AAGAVKK112 pKa = 8.9KK113 pKa = 8.45TAAKK117 pKa = 9.62KK118 pKa = 10.42APAKK122 pKa = 10.26RR123 pKa = 11.84STAAKK128 pKa = 8.02STPAKK133 pKa = 9.65STTAGSAVKK142 pKa = 8.98KK143 pKa = 9.04TVGAKK148 pKa = 6.46TTAKK152 pKa = 10.2KK153 pKa = 10.68APAKK157 pKa = 10.16KK158 pKa = 9.17ATATRR163 pKa = 11.84STAPGTRR170 pKa = 11.84ATAKK174 pKa = 10.13KK175 pKa = 10.38APAKK179 pKa = 10.27KK180 pKa = 9.3ATTAKK185 pKa = 9.42STTSRR190 pKa = 11.84AATGARR196 pKa = 11.84KK197 pKa = 6.54TTVGAIKK204 pKa = 10.57KK205 pKa = 8.27ATAKK209 pKa = 10.58KK210 pKa = 10.49AGTTTTRR217 pKa = 11.84TPAKK221 pKa = 10.17KK222 pKa = 8.55ITARR226 pKa = 11.84KK227 pKa = 9.49APAKK231 pKa = 10.06KK232 pKa = 9.78VAARR236 pKa = 11.84QAPAKK241 pKa = 9.71KK242 pKa = 8.71STRR245 pKa = 11.84ATVRR249 pKa = 11.84KK250 pKa = 9.29AAGG253 pKa = 3.12
MM1 pKa = 7.84AEE3 pKa = 4.06ALKK6 pKa = 9.74ATSRR10 pKa = 11.84PAAKK14 pKa = 8.96RR15 pKa = 11.84TGVKK19 pKa = 8.77KK20 pKa = 7.29TTAARR25 pKa = 11.84STTGAKK31 pKa = 7.71KK32 pKa = 8.88TPAARR37 pKa = 11.84KK38 pKa = 4.52TTAAAKK44 pKa = 8.78STTTAARR51 pKa = 11.84PTSTRR56 pKa = 11.84ATATRR61 pKa = 11.84PATAKK66 pKa = 9.05KK67 pKa = 7.95TAAKK71 pKa = 9.46KK72 pKa = 10.76APVKK76 pKa = 10.27KK77 pKa = 10.16AAAKK81 pKa = 6.59TTTAKK86 pKa = 9.32KK87 pKa = 8.54TVASKK92 pKa = 10.75AATARR97 pKa = 11.84KK98 pKa = 9.32KK99 pKa = 10.01ATTAATRR106 pKa = 11.84AAGAVKK112 pKa = 8.9KK113 pKa = 8.45TAAKK117 pKa = 9.62KK118 pKa = 10.42APAKK122 pKa = 10.26RR123 pKa = 11.84STAAKK128 pKa = 8.02STPAKK133 pKa = 9.65STTAGSAVKK142 pKa = 8.98KK143 pKa = 9.04TVGAKK148 pKa = 6.46TTAKK152 pKa = 10.2KK153 pKa = 10.68APAKK157 pKa = 10.16KK158 pKa = 9.17ATATRR163 pKa = 11.84STAPGTRR170 pKa = 11.84ATAKK174 pKa = 10.13KK175 pKa = 10.38APAKK179 pKa = 10.27KK180 pKa = 9.3ATTAKK185 pKa = 9.42STTSRR190 pKa = 11.84AATGARR196 pKa = 11.84KK197 pKa = 6.54TTVGAIKK204 pKa = 10.57KK205 pKa = 8.27ATAKK209 pKa = 10.58KK210 pKa = 10.49AGTTTTRR217 pKa = 11.84TPAKK221 pKa = 10.17KK222 pKa = 8.55ITARR226 pKa = 11.84KK227 pKa = 9.49APAKK231 pKa = 10.06KK232 pKa = 9.78VAARR236 pKa = 11.84QAPAKK241 pKa = 9.71KK242 pKa = 8.71STRR245 pKa = 11.84ATVRR249 pKa = 11.84KK250 pKa = 9.29AAGG253 pKa = 3.12
Molecular weight: 25.2 kDa
Isoelectric point according different methods:
Peptides (in silico digests for buttom-up proteomics)
Below you can find in silico digests of the whole proteome with Trypsin, Chymotrypsin, Trypsin+LysC, LysN, ArgC proteases suitable for different mass spec machines.| Try ESI |
 |
|---|
| ChTry ESI |
|
|---|
| ArgC ESI |
|
|---|
| LysN ESI |
|
|---|
| TryLysC ESI |
|
|---|
| Try MALDI |
|
|---|
| ChTry MALDI |
|
|---|
| ArgC MALDI |
|
|---|
| LysN MALDI |
|
|---|
| TryLysC MALDI |
|
|---|
| Try LTQ |
|
|---|
| ChTry LTQ |
|
|---|
| ArgC LTQ |
|
|---|
| LysN LTQ |
|
|---|
| TryLysC LTQ |
|
|---|
| Try MSlow |
|
|---|
| ChTry MSlow |
|
|---|
| ArgC MSlow |
|
|---|
| LysN MSlow |
|
|---|
| TryLysC MSlow |
|
|---|
| Try MShigh |
|
|---|
| ChTry MShigh |
|
|---|
| ArgC MShigh |
|
|---|
| LysN MShigh |
|
|---|
| TryLysC MShigh |
|
|---|
General Statistics
Number of major isoforms |
Number of additional isoforms |
Number of all proteins |
Number of amino acids |
Min. Seq. Length |
Max. Seq. Length |
Avg. Seq. Length |
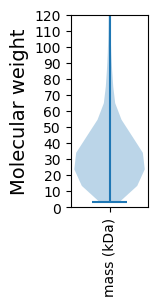
Avg. Mol. Weight |
|---|---|---|---|---|---|---|---|
0 |
2538772 |
29 |
9546 |
342.7 |
36.65 |
Amino acid frequency
Ala |
Cys |
Asp |
Glu |
Phe |
Gly |
His |
Ile |
Lys |
Leu |
|---|---|---|---|---|---|---|---|---|---|
13.352 ± 0.044 | 0.699 ± 0.007 |
5.965 ± 0.023 | 5.069 ± 0.027 |
2.704 ± 0.015 | 9.417 ± 0.03 |
2.073 ± 0.012 | 3.402 ± 0.019 |
1.605 ± 0.019 | 10.441 ± 0.041 |
Met |
Asn |
Gln |
Pro |
Arg |
Ser |
Thr |
Val |
Trp |
Tyr |
|---|---|---|---|---|---|---|---|---|---|
1.614 ± 0.01 | 2.045 ± 0.02 |
6.37 ± 0.027 | 2.928 ± 0.017 |
8.151 ± 0.03 | 5.079 ± 0.025 |
6.454 ± 0.028 | 8.878 ± 0.027 |
1.613 ± 0.011 | 2.14 ± 0.015 |
Most of the basic statistics you can see at this page can be downloaded from this CSV file
See this proteome in:

Proteome-pI is available under Creative Commons Attribution-NoDerivs license, for more details see here
| Reference: Kozlowski LP. Proteome-pI 2.0: Proteome Isoelectric Point Database Update. Nucleic Acids Res. 2021, doi: 10.1093/nar/gkab944 | Contact: Lukasz P. Kozlowski |