Cohnella sp. CAU 1483
Taxonomy: cellular organisms; Bacteria; Terrabacteria group; Firmicutes; Bacilli; Bacillales; Paenibacillaceae; Cohnella
Average proteome isoelectric point is 6.53
Get precalculated fractions of proteins
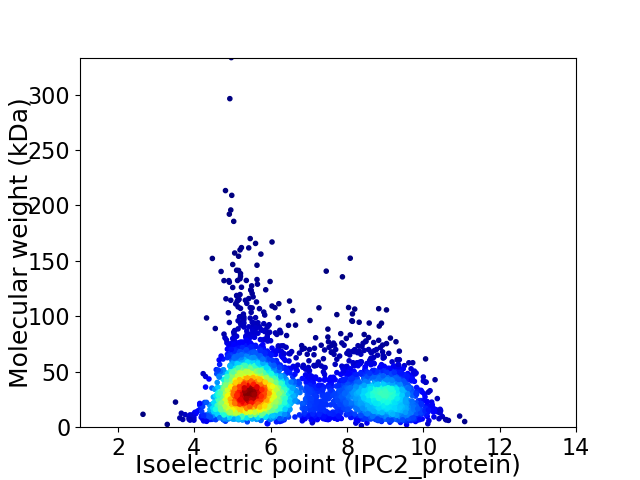
Virtual 2D-PAGE plot for 4000 proteins (isoelectric point calculated using IPC2_protein)
Get csv file with sequences according to given criteria:
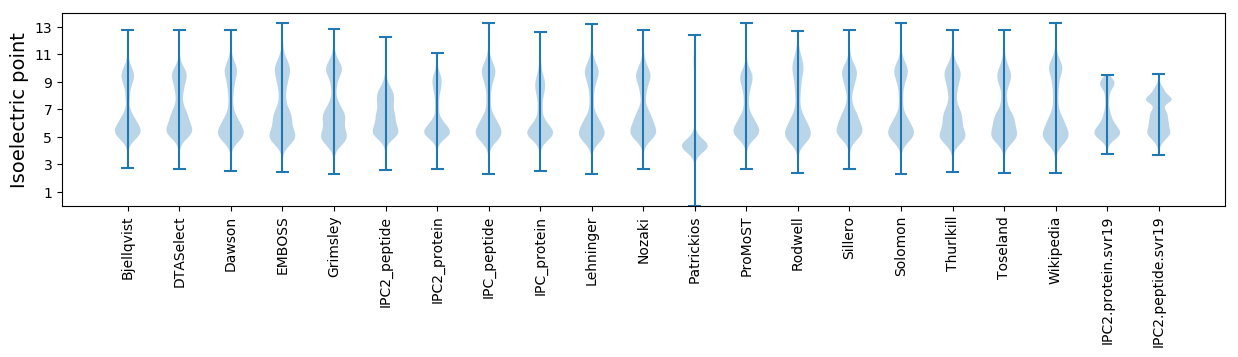
* You can choose from 21 different methods for calculating isoelectric point
Summary statistics related to proteome-wise predictions
Protein with the lowest isoelectric point:
>tr|A0A4U0FB07|A0A4U0FB07_9BACL Flagellar secretion chaperone FliS OS=Cohnella sp. CAU 1483 OX=2564100 GN=fliS PE=3 SV=1
MM1 pKa = 7.37NIEE4 pKa = 4.09RR5 pKa = 11.84AQQIAQSDD13 pKa = 3.98EE14 pKa = 4.22LVDD17 pKa = 3.96VIYY20 pKa = 11.05YY21 pKa = 8.72GASYY25 pKa = 10.92YY26 pKa = 9.85IDD28 pKa = 3.54QVDD31 pKa = 4.03EE32 pKa = 4.24TSGMARR38 pKa = 11.84IYY40 pKa = 10.84SRR42 pKa = 11.84EE43 pKa = 4.01NPDD46 pKa = 5.15DD47 pKa = 4.02PMQTVPVIALTEE59 pKa = 4.26PDD61 pKa = 3.5SFRR64 pKa = 11.84VV65 pKa = 3.46
MM1 pKa = 7.37NIEE4 pKa = 4.09RR5 pKa = 11.84AQQIAQSDD13 pKa = 3.98EE14 pKa = 4.22LVDD17 pKa = 3.96VIYY20 pKa = 11.05YY21 pKa = 8.72GASYY25 pKa = 10.92YY26 pKa = 9.85IDD28 pKa = 3.54QVDD31 pKa = 4.03EE32 pKa = 4.24TSGMARR38 pKa = 11.84IYY40 pKa = 10.84SRR42 pKa = 11.84EE43 pKa = 4.01NPDD46 pKa = 5.15DD47 pKa = 4.02PMQTVPVIALTEE59 pKa = 4.26PDD61 pKa = 3.5SFRR64 pKa = 11.84VV65 pKa = 3.46
Molecular weight: 7.42 kDa
Isoelectric point according different methods:
Protein with the highest isoelectric point:
>tr|A0A4U0FAM6|A0A4U0FAM6_9BACL DEAD/DEAH box helicase OS=Cohnella sp. CAU 1483 OX=2564100 GN=E5161_13040 PE=4 SV=1
MM1 pKa = 7.61GPTFKK6 pKa = 10.87PNVSKK11 pKa = 10.8RR12 pKa = 11.84KK13 pKa = 8.95KK14 pKa = 8.25VHH16 pKa = 5.49GFRR19 pKa = 11.84KK20 pKa = 10.01RR21 pKa = 11.84MSTKK25 pKa = 10.27NGRR28 pKa = 11.84KK29 pKa = 8.13VLKK32 pKa = 10.34ARR34 pKa = 11.84RR35 pKa = 11.84QKK37 pKa = 10.22GRR39 pKa = 11.84KK40 pKa = 8.88VLTAA44 pKa = 4.27
MM1 pKa = 7.61GPTFKK6 pKa = 10.87PNVSKK11 pKa = 10.8RR12 pKa = 11.84KK13 pKa = 8.95KK14 pKa = 8.25VHH16 pKa = 5.49GFRR19 pKa = 11.84KK20 pKa = 10.01RR21 pKa = 11.84MSTKK25 pKa = 10.27NGRR28 pKa = 11.84KK29 pKa = 8.13VLKK32 pKa = 10.34ARR34 pKa = 11.84RR35 pKa = 11.84QKK37 pKa = 10.22GRR39 pKa = 11.84KK40 pKa = 8.88VLTAA44 pKa = 4.27
Molecular weight: 5.11 kDa
Isoelectric point according different methods:
Peptides (in silico digests for buttom-up proteomics)
Below you can find in silico digests of the whole proteome with Trypsin, Chymotrypsin, Trypsin+LysC, LysN, ArgC proteases suitable for different mass spec machines.| Try ESI |
 |
|---|
| ChTry ESI |
|
|---|
| ArgC ESI |
|
|---|
| LysN ESI |
|
|---|
| TryLysC ESI |
|
|---|
| Try MALDI |
|
|---|
| ChTry MALDI |
|
|---|
| ArgC MALDI |
|
|---|
| LysN MALDI |
|
|---|
| TryLysC MALDI |
|
|---|
| Try LTQ |
|
|---|
| ChTry LTQ |
|
|---|
| ArgC LTQ |
|
|---|
| LysN LTQ |
|
|---|
| TryLysC LTQ |
|
|---|
| Try MSlow |
|
|---|
| ChTry MSlow |
|
|---|
| ArgC MSlow |
|
|---|
| LysN MSlow |
|
|---|
| TryLysC MSlow |
|
|---|
| Try MShigh |
|
|---|
| ChTry MShigh |
|
|---|
| ArgC MShigh |
|
|---|
| LysN MShigh |
|
|---|
| TryLysC MShigh |
|
|---|
General Statistics
Number of major isoforms |
Number of additional isoforms |
Number of all proteins |
Number of amino acids |
Min. Seq. Length |
Max. Seq. Length |
Avg. Seq. Length |
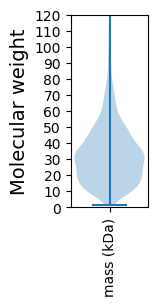
Avg. Mol. Weight |
|---|---|---|---|---|---|---|---|
0 |
1262812 |
11 |
3273 |
315.7 |
35.04 |
Amino acid frequency
Ala |
Cys |
Asp |
Glu |
Phe |
Gly |
His |
Ile |
Lys |
Leu |
|---|---|---|---|---|---|---|---|---|---|
8.968 ± 0.047 | 0.743 ± 0.012 |
5.227 ± 0.027 | 6.602 ± 0.041 |
4.085 ± 0.03 | 7.778 ± 0.04 |
2.086 ± 0.02 | 6.112 ± 0.033 |
5.06 ± 0.033 | 10.02 ± 0.046 |
Met |
Asn |
Gln |
Pro |
Arg |
Ser |
Thr |
Val |
Trp |
Tyr |
|---|---|---|---|---|---|---|---|---|---|
2.791 ± 0.021 | 3.449 ± 0.029 |
4.379 ± 0.024 | 3.583 ± 0.021 |
5.865 ± 0.041 | 6.034 ± 0.033 |
5.298 ± 0.032 | 7.439 ± 0.033 |
1.325 ± 0.016 | 3.159 ± 0.025 |
Most of the basic statistics you can see at this page can be downloaded from this CSV file
See this proteome in:

Proteome-pI is available under Creative Commons Attribution-NoDerivs license, for more details see here
| Reference: Kozlowski LP. Proteome-pI 2.0: Proteome Isoelectric Point Database Update. Nucleic Acids Res. 2021, doi: 10.1093/nar/gkab944 | Contact: Lukasz P. Kozlowski |