Desulfovibrio piger ATCC 29098
Taxonomy: cellular organisms; Bacteria; Proteobacteria; delta/epsilon subdivisions; Deltaproteobacteria; Desulfovibrionales; Desulfovibrionaceae; Desulfovibrio; Desulfovibrio piger
Average proteome isoelectric point is 6.89
Get precalculated fractions of proteins
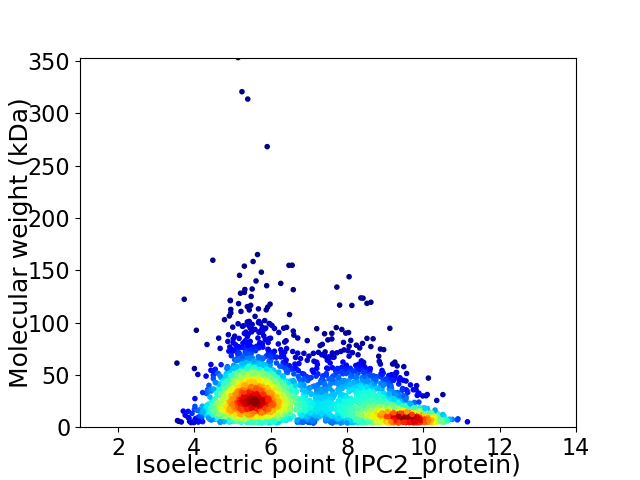
Virtual 2D-PAGE plot for 3106 proteins (isoelectric point calculated using IPC2_protein)
Get csv file with sequences according to given criteria:
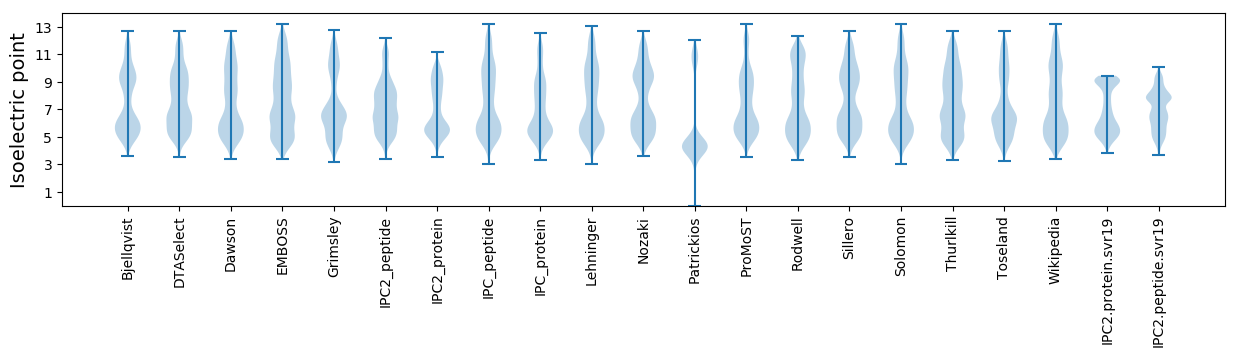
* You can choose from 21 different methods for calculating isoelectric point
Summary statistics related to proteome-wise predictions
Protein with the lowest isoelectric point:
>tr|B6WTB1|B6WTB1_9DELT Uncharacterized protein OS=Desulfovibrio piger ATCC 29098 OX=411464 GN=DESPIG_01316 PE=4 SV=1
MM1 pKa = 7.42LGWDD5 pKa = 4.01GMVCSLASLLLFLDD19 pKa = 3.71IFLLLAVYY27 pKa = 9.78AVSQVPIMHH36 pKa = 6.88GDD38 pKa = 3.45EE39 pKa = 4.21VV40 pKa = 3.62
MM1 pKa = 7.42LGWDD5 pKa = 4.01GMVCSLASLLLFLDD19 pKa = 3.71IFLLLAVYY27 pKa = 9.78AVSQVPIMHH36 pKa = 6.88GDD38 pKa = 3.45EE39 pKa = 4.21VV40 pKa = 3.62
Molecular weight: 4.38 kDa
Isoelectric point according different methods:
Protein with the highest isoelectric point:
>tr|B6WWK2|B6WWK2_9DELT Uncharacterized protein OS=Desulfovibrio piger ATCC 29098 OX=411464 GN=DESPIG_02470 PE=4 SV=1
MM1 pKa = 7.35KK2 pKa = 9.43RR3 pKa = 11.84TYY5 pKa = 10.25QPSKK9 pKa = 8.87VRR11 pKa = 11.84RR12 pKa = 11.84ARR14 pKa = 11.84THH16 pKa = 5.76GFRR19 pKa = 11.84ARR21 pKa = 11.84MATPSGRR28 pKa = 11.84AILRR32 pKa = 11.84RR33 pKa = 11.84RR34 pKa = 11.84RR35 pKa = 11.84AKK37 pKa = 10.07GRR39 pKa = 11.84KK40 pKa = 8.63HH41 pKa = 6.58LSAA44 pKa = 5.8
MM1 pKa = 7.35KK2 pKa = 9.43RR3 pKa = 11.84TYY5 pKa = 10.25QPSKK9 pKa = 8.87VRR11 pKa = 11.84RR12 pKa = 11.84ARR14 pKa = 11.84THH16 pKa = 5.76GFRR19 pKa = 11.84ARR21 pKa = 11.84MATPSGRR28 pKa = 11.84AILRR32 pKa = 11.84RR33 pKa = 11.84RR34 pKa = 11.84RR35 pKa = 11.84AKK37 pKa = 10.07GRR39 pKa = 11.84KK40 pKa = 8.63HH41 pKa = 6.58LSAA44 pKa = 5.8
Molecular weight: 5.18 kDa
Isoelectric point according different methods:
Peptides (in silico digests for buttom-up proteomics)
Below you can find in silico digests of the whole proteome with Trypsin, Chymotrypsin, Trypsin+LysC, LysN, ArgC proteases suitable for different mass spec machines.| Try ESI |
 |
|---|
| ChTry ESI |
|
|---|
| ArgC ESI |
|
|---|
| LysN ESI |
|
|---|
| TryLysC ESI |
|
|---|
| Try MALDI |
|
|---|
| ChTry MALDI |
|
|---|
| ArgC MALDI |
|
|---|
| LysN MALDI |
|
|---|
| TryLysC MALDI |
|
|---|
| Try LTQ |
|
|---|
| ChTry LTQ |
|
|---|
| ArgC LTQ |
|
|---|
| LysN LTQ |
|
|---|
| TryLysC LTQ |
|
|---|
| Try MSlow |
|
|---|
| ChTry MSlow |
|
|---|
| ArgC MSlow |
|
|---|
| LysN MSlow |
|
|---|
| TryLysC MSlow |
|
|---|
| Try MShigh |
|
|---|
| ChTry MShigh |
|
|---|
| ArgC MShigh |
|
|---|
| LysN MShigh |
|
|---|
| TryLysC MShigh |
|
|---|
General Statistics
Number of major isoforms |
Number of additional isoforms |
Number of all proteins |
Number of amino acids |
Min. Seq. Length |
Max. Seq. Length |
Avg. Seq. Length |
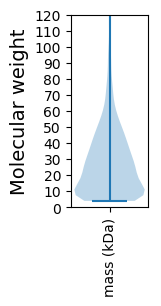
Avg. Mol. Weight |
|---|---|---|---|---|---|---|---|
0 |
841498 |
39 |
3246 |
270.9 |
29.73 |
Amino acid frequency
Ala |
Cys |
Asp |
Glu |
Phe |
Gly |
His |
Ile |
Lys |
Leu |
|---|---|---|---|---|---|---|---|---|---|
11.031 ± 0.068 | 1.745 ± 0.023 |
5.326 ± 0.042 | 5.922 ± 0.049 |
3.739 ± 0.035 | 8.291 ± 0.045 |
2.228 ± 0.024 | 4.54 ± 0.052 |
3.695 ± 0.047 | 11.125 ± 0.064 |
Met |
Asn |
Gln |
Pro |
Arg |
Ser |
Thr |
Val |
Trp |
Tyr |
|---|---|---|---|---|---|---|---|---|---|
2.851 ± 0.023 | 2.551 ± 0.031 |
5.369 ± 0.042 | 3.568 ± 0.033 |
7.194 ± 0.056 | 5.419 ± 0.029 |
4.724 ± 0.03 | 6.895 ± 0.044 |
1.354 ± 0.02 | 2.432 ± 0.03 |
Most of the basic statistics you can see at this page can be downloaded from this CSV file
See this proteome in:

Proteome-pI is available under Creative Commons Attribution-NoDerivs license, for more details see here
| Reference: Kozlowski LP. Proteome-pI 2.0: Proteome Isoelectric Point Database Update. Nucleic Acids Res. 2021, doi: 10.1093/nar/gkab944 | Contact: Lukasz P. Kozlowski |