Tepidamorphus gemmatus
Taxonomy: cellular organisms; Bacteria; Proteobacteria; Alphaproteobacteria; Hyphomicrobiales; Tepidamorphaceae; Tepidamorphus
Average proteome isoelectric point is 6.59
Get precalculated fractions of proteins
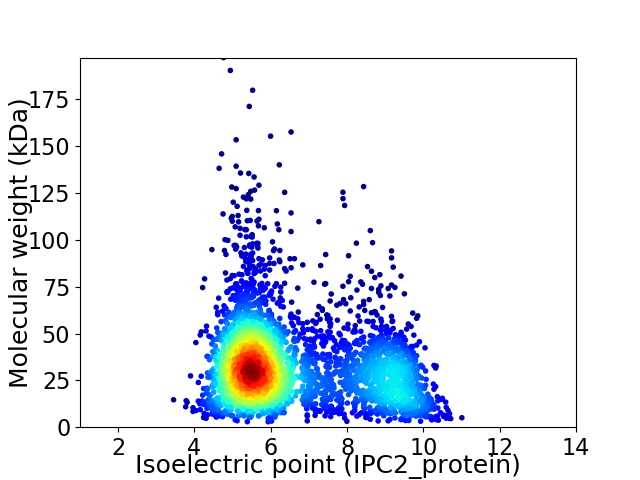
Virtual 2D-PAGE plot for 3554 proteins (isoelectric point calculated using IPC2_protein)
Get csv file with sequences according to given criteria:
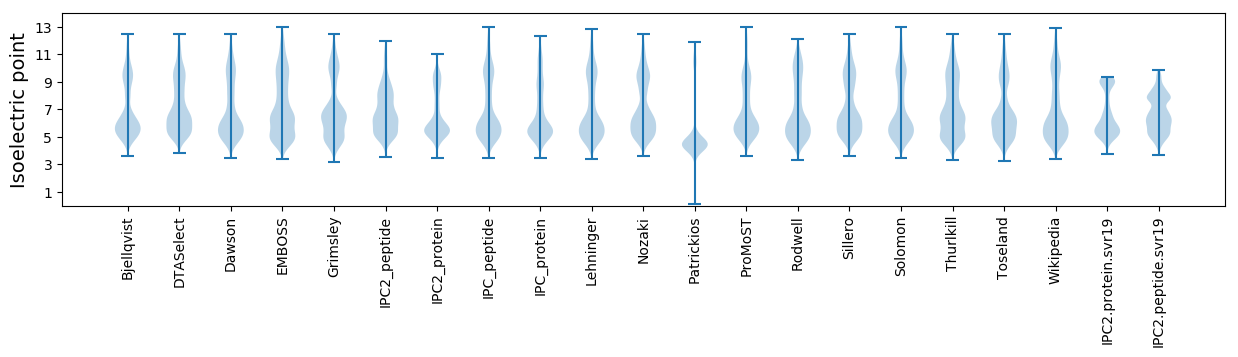
* You can choose from 21 different methods for calculating isoelectric point
Summary statistics related to proteome-wise predictions
Protein with the lowest isoelectric point:
>tr|A0A4V2UXZ6|A0A4V2UXZ6_9RHIZ CHAD domain-containing protein OS=Tepidamorphus gemmatus OX=747076 GN=EDC22_11320 PE=4 SV=1
MM1 pKa = 7.83SDD3 pKa = 3.32EE4 pKa = 4.48CCEE7 pKa = 4.08DD8 pKa = 3.11VHH10 pKa = 8.8VYY12 pKa = 10.66VLVGRR17 pKa = 11.84ASRR20 pKa = 11.84AGPLADD26 pKa = 5.17GYY28 pKa = 11.4DD29 pKa = 3.56PSEE32 pKa = 4.86DD33 pKa = 3.62EE34 pKa = 4.17NDD36 pKa = 3.56AVPVNVLLTATDD48 pKa = 3.21EE49 pKa = 4.36GAAISRR55 pKa = 11.84ALAALANEE63 pKa = 5.14GYY65 pKa = 10.54GRR67 pKa = 11.84AEE69 pKa = 4.46LDD71 pKa = 3.45RR72 pKa = 11.84IGIVDD77 pKa = 4.86GEE79 pKa = 4.27PDD81 pKa = 4.2DD82 pKa = 4.0PTFAAAYY89 pKa = 7.91WDD91 pKa = 4.85AIDD94 pKa = 5.36GEE96 pKa = 4.64VAVIAFHH103 pKa = 6.84GG104 pKa = 3.8
MM1 pKa = 7.83SDD3 pKa = 3.32EE4 pKa = 4.48CCEE7 pKa = 4.08DD8 pKa = 3.11VHH10 pKa = 8.8VYY12 pKa = 10.66VLVGRR17 pKa = 11.84ASRR20 pKa = 11.84AGPLADD26 pKa = 5.17GYY28 pKa = 11.4DD29 pKa = 3.56PSEE32 pKa = 4.86DD33 pKa = 3.62EE34 pKa = 4.17NDD36 pKa = 3.56AVPVNVLLTATDD48 pKa = 3.21EE49 pKa = 4.36GAAISRR55 pKa = 11.84ALAALANEE63 pKa = 5.14GYY65 pKa = 10.54GRR67 pKa = 11.84AEE69 pKa = 4.46LDD71 pKa = 3.45RR72 pKa = 11.84IGIVDD77 pKa = 4.86GEE79 pKa = 4.27PDD81 pKa = 4.2DD82 pKa = 4.0PTFAAAYY89 pKa = 7.91WDD91 pKa = 4.85AIDD94 pKa = 5.36GEE96 pKa = 4.64VAVIAFHH103 pKa = 6.84GG104 pKa = 3.8
Molecular weight: 10.88 kDa
Isoelectric point according different methods:
Protein with the highest isoelectric point:
>tr|A0A4R3MHJ1|A0A4R3MHJ1_9RHIZ Head-tail adaptor OS=Tepidamorphus gemmatus OX=747076 GN=EDC22_102353 PE=4 SV=1
MM1 pKa = 7.66AVRR4 pKa = 11.84SILFNIAFYY13 pKa = 11.31LNIIVWMIGCTPMLLLPRR31 pKa = 11.84RR32 pKa = 11.84WTIGCVHH39 pKa = 6.16GWARR43 pKa = 11.84CSTWLLEE50 pKa = 4.45VIGGVRR56 pKa = 11.84VEE58 pKa = 4.2VRR60 pKa = 11.84GGLPRR65 pKa = 11.84RR66 pKa = 11.84GMPLLVAAKK75 pKa = 8.63HH76 pKa = 4.81QSVFEE81 pKa = 4.18TFALLPYY88 pKa = 10.33FSDD91 pKa = 3.36PAFILKK97 pKa = 10.21RR98 pKa = 11.84EE99 pKa = 4.3LTWIPLFGWWCRR111 pKa = 11.84KK112 pKa = 7.44MRR114 pKa = 11.84MIPVDD119 pKa = 3.52RR120 pKa = 11.84GRR122 pKa = 11.84GATALKK128 pKa = 10.81DD129 pKa = 3.48MARR132 pKa = 11.84RR133 pKa = 11.84AHH135 pKa = 6.74AEE137 pKa = 3.76AARR140 pKa = 11.84GRR142 pKa = 11.84QIVIFPEE149 pKa = 4.5GTRR152 pKa = 11.84RR153 pKa = 11.84PPGAPPQYY161 pKa = 9.79KK162 pKa = 9.9QGVSLLYY169 pKa = 9.89ATMQVPCLPVALNSGLFWPRR189 pKa = 11.84RR190 pKa = 11.84KK191 pKa = 7.93WQRR194 pKa = 11.84YY195 pKa = 6.61PGTILVEE202 pKa = 4.36FLEE205 pKa = 5.32PIPPGLDD212 pKa = 2.39RR213 pKa = 11.84EE214 pKa = 4.56AFRR217 pKa = 11.84EE218 pKa = 3.89RR219 pKa = 11.84LEE221 pKa = 4.29TAIEE225 pKa = 4.08TASDD229 pKa = 3.64RR230 pKa = 11.84LLGEE234 pKa = 4.22AAAAPNPPPIPDD246 pKa = 3.31EE247 pKa = 3.93ARR249 pKa = 11.84ARR251 pKa = 11.84LEE253 pKa = 3.99GMVAAATPTTPPPRR267 pKa = 11.84RR268 pKa = 11.84QAGG271 pKa = 3.25
MM1 pKa = 7.66AVRR4 pKa = 11.84SILFNIAFYY13 pKa = 11.31LNIIVWMIGCTPMLLLPRR31 pKa = 11.84RR32 pKa = 11.84WTIGCVHH39 pKa = 6.16GWARR43 pKa = 11.84CSTWLLEE50 pKa = 4.45VIGGVRR56 pKa = 11.84VEE58 pKa = 4.2VRR60 pKa = 11.84GGLPRR65 pKa = 11.84RR66 pKa = 11.84GMPLLVAAKK75 pKa = 8.63HH76 pKa = 4.81QSVFEE81 pKa = 4.18TFALLPYY88 pKa = 10.33FSDD91 pKa = 3.36PAFILKK97 pKa = 10.21RR98 pKa = 11.84EE99 pKa = 4.3LTWIPLFGWWCRR111 pKa = 11.84KK112 pKa = 7.44MRR114 pKa = 11.84MIPVDD119 pKa = 3.52RR120 pKa = 11.84GRR122 pKa = 11.84GATALKK128 pKa = 10.81DD129 pKa = 3.48MARR132 pKa = 11.84RR133 pKa = 11.84AHH135 pKa = 6.74AEE137 pKa = 3.76AARR140 pKa = 11.84GRR142 pKa = 11.84QIVIFPEE149 pKa = 4.5GTRR152 pKa = 11.84RR153 pKa = 11.84PPGAPPQYY161 pKa = 9.79KK162 pKa = 9.9QGVSLLYY169 pKa = 9.89ATMQVPCLPVALNSGLFWPRR189 pKa = 11.84RR190 pKa = 11.84KK191 pKa = 7.93WQRR194 pKa = 11.84YY195 pKa = 6.61PGTILVEE202 pKa = 4.36FLEE205 pKa = 5.32PIPPGLDD212 pKa = 2.39RR213 pKa = 11.84EE214 pKa = 4.56AFRR217 pKa = 11.84EE218 pKa = 3.89RR219 pKa = 11.84LEE221 pKa = 4.29TAIEE225 pKa = 4.08TASDD229 pKa = 3.64RR230 pKa = 11.84LLGEE234 pKa = 4.22AAAAPNPPPIPDD246 pKa = 3.31EE247 pKa = 3.93ARR249 pKa = 11.84ARR251 pKa = 11.84LEE253 pKa = 3.99GMVAAATPTTPPPRR267 pKa = 11.84RR268 pKa = 11.84QAGG271 pKa = 3.25
Molecular weight: 30.41 kDa
Isoelectric point according different methods:
Peptides (in silico digests for buttom-up proteomics)
Below you can find in silico digests of the whole proteome with Trypsin, Chymotrypsin, Trypsin+LysC, LysN, ArgC proteases suitable for different mass spec machines.| Try ESI |
 |
|---|
| ChTry ESI |
|
|---|
| ArgC ESI |
|
|---|
| LysN ESI |
|
|---|
| TryLysC ESI |
|
|---|
| Try MALDI |
|
|---|
| ChTry MALDI |
|
|---|
| ArgC MALDI |
|
|---|
| LysN MALDI |
|
|---|
| TryLysC MALDI |
|
|---|
| Try LTQ |
|
|---|
| ChTry LTQ |
|
|---|
| ArgC LTQ |
|
|---|
| LysN LTQ |
|
|---|
| TryLysC LTQ |
|
|---|
| Try MSlow |
|
|---|
| ChTry MSlow |
|
|---|
| ArgC MSlow |
|
|---|
| LysN MSlow |
|
|---|
| TryLysC MSlow |
|
|---|
| Try MShigh |
|
|---|
| ChTry MShigh |
|
|---|
| ArgC MShigh |
|
|---|
| LysN MShigh |
|
|---|
| TryLysC MShigh |
|
|---|
General Statistics
Number of major isoforms |
Number of additional isoforms |
Number of all proteins |
Number of amino acids |
Min. Seq. Length |
Max. Seq. Length |
Avg. Seq. Length |
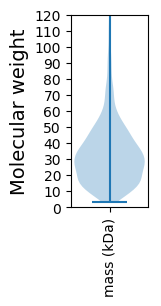
Avg. Mol. Weight |
|---|---|---|---|---|---|---|---|
0 |
1129158 |
28 |
1830 |
317.7 |
34.37 |
Amino acid frequency
Ala |
Cys |
Asp |
Glu |
Phe |
Gly |
His |
Ile |
Lys |
Leu |
|---|---|---|---|---|---|---|---|---|---|
13.506 ± 0.063 | 0.86 ± 0.014 |
5.681 ± 0.032 | 5.79 ± 0.034 |
3.545 ± 0.022 | 8.834 ± 0.034 |
1.966 ± 0.023 | 5.27 ± 0.03 |
2.307 ± 0.03 | 10.075 ± 0.051 |
Met |
Asn |
Gln |
Pro |
Arg |
Ser |
Thr |
Val |
Trp |
Tyr |
|---|---|---|---|---|---|---|---|---|---|
2.429 ± 0.019 | 2.124 ± 0.022 |
5.476 ± 0.033 | 2.628 ± 0.021 |
8.317 ± 0.043 | 4.739 ± 0.023 |
5.109 ± 0.026 | 7.87 ± 0.036 |
1.341 ± 0.018 | 2.132 ± 0.022 |
Most of the basic statistics you can see at this page can be downloaded from this CSV file
See this proteome in:

Proteome-pI is available under Creative Commons Attribution-NoDerivs license, for more details see here
| Reference: Kozlowski LP. Proteome-pI 2.0: Proteome Isoelectric Point Database Update. Nucleic Acids Res. 2021, doi: 10.1093/nar/gkab944 | Contact: Lukasz P. Kozlowski |