Sphingomonas sp. SRS2
Taxonomy: cellular organisms; Bacteria; Proteobacteria; Alphaproteobacteria; Sphingomonadales; Sphingomonadaceae; Sphingomonas; unclassified Sphingomonas
Average proteome isoelectric point is 6.62
Get precalculated fractions of proteins
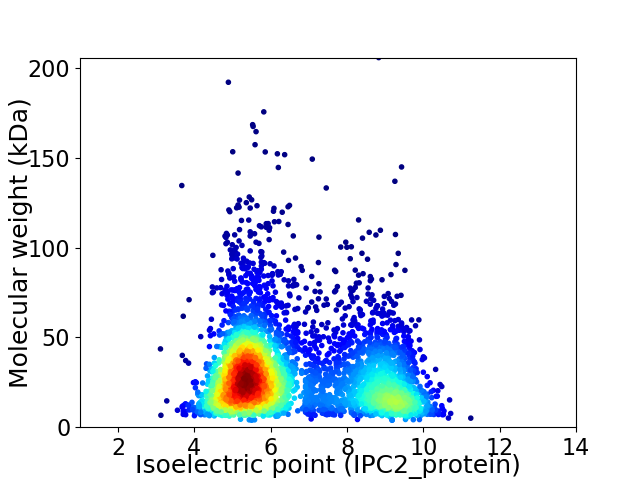
Virtual 2D-PAGE plot for 4289 proteins (isoelectric point calculated using IPC2_protein)
Get csv file with sequences according to given criteria:
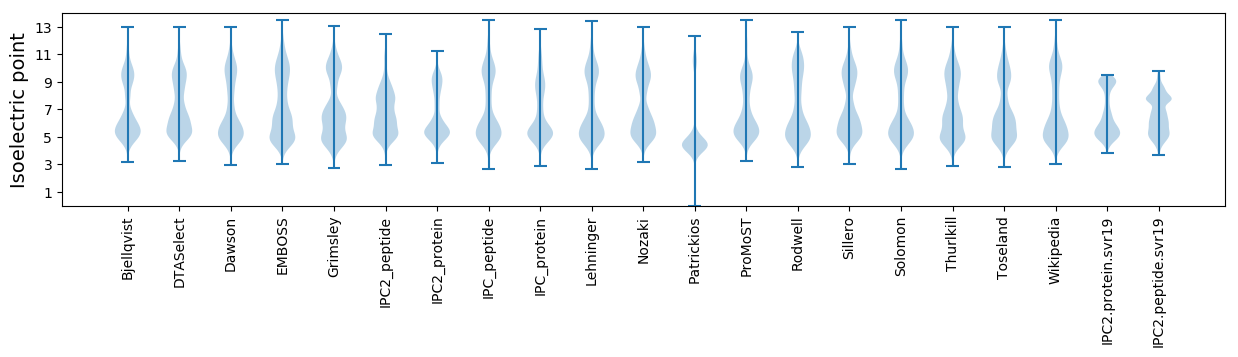
* You can choose from 21 different methods for calculating isoelectric point
Summary statistics related to proteome-wise predictions
Protein with the lowest isoelectric point:
>tr|A0A0F5P9L5|A0A0F5P9L5_9SPHN Uncharacterized protein OS=Sphingomonas sp. SRS2 OX=133190 GN=WP12_16600 PE=4 SV=1
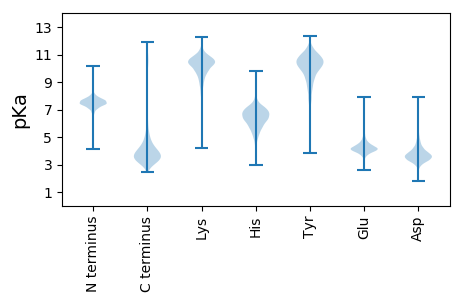
MM1 pKa = 7.67EE2 pKa = 6.79DD3 pKa = 2.9IMTIEE8 pKa = 4.24STRR11 pKa = 11.84CCDD14 pKa = 6.2DD15 pKa = 3.31FALWPDD21 pKa = 4.14GSWATLGDD29 pKa = 3.73ISNGDD34 pKa = 3.83YY35 pKa = 10.18HH36 pKa = 6.75WKK38 pKa = 10.2SDD40 pKa = 3.56DD41 pKa = 3.78YY42 pKa = 11.66EE43 pKa = 5.67IISYY47 pKa = 10.92LEE49 pKa = 4.05TEE51 pKa = 4.44RR52 pKa = 11.84LTALGVYY59 pKa = 7.85EE60 pKa = 4.14
MM1 pKa = 7.67EE2 pKa = 6.79DD3 pKa = 2.9IMTIEE8 pKa = 4.24STRR11 pKa = 11.84CCDD14 pKa = 6.2DD15 pKa = 3.31FALWPDD21 pKa = 4.14GSWATLGDD29 pKa = 3.73ISNGDD34 pKa = 3.83YY35 pKa = 10.18HH36 pKa = 6.75WKK38 pKa = 10.2SDD40 pKa = 3.56DD41 pKa = 3.78YY42 pKa = 11.66EE43 pKa = 5.67IISYY47 pKa = 10.92LEE49 pKa = 4.05TEE51 pKa = 4.44RR52 pKa = 11.84LTALGVYY59 pKa = 7.85EE60 pKa = 4.14
Molecular weight: 6.94 kDa
Isoelectric point according different methods:
Protein with the highest isoelectric point:
>tr|A0A0F5PFJ5|A0A0F5PFJ5_9SPHN Photosystem reaction center subunit H OS=Sphingomonas sp. SRS2 OX=133190 GN=WP12_04190 PE=4 SV=1
MM1 pKa = 7.45KK2 pKa = 9.61RR3 pKa = 11.84TFQPSNLVRR12 pKa = 11.84KK13 pKa = 8.96RR14 pKa = 11.84RR15 pKa = 11.84HH16 pKa = 4.61GFRR19 pKa = 11.84SRR21 pKa = 11.84SATPGGRR28 pKa = 11.84KK29 pKa = 8.76ILAARR34 pKa = 11.84RR35 pKa = 11.84ARR37 pKa = 11.84GRR39 pKa = 11.84IKK41 pKa = 10.86LSAA44 pKa = 3.84
MM1 pKa = 7.45KK2 pKa = 9.61RR3 pKa = 11.84TFQPSNLVRR12 pKa = 11.84KK13 pKa = 8.96RR14 pKa = 11.84RR15 pKa = 11.84HH16 pKa = 4.61GFRR19 pKa = 11.84SRR21 pKa = 11.84SATPGGRR28 pKa = 11.84KK29 pKa = 8.76ILAARR34 pKa = 11.84RR35 pKa = 11.84ARR37 pKa = 11.84GRR39 pKa = 11.84IKK41 pKa = 10.86LSAA44 pKa = 3.84
Molecular weight: 5.05 kDa
Isoelectric point according different methods:
Peptides (in silico digests for buttom-up proteomics)
Below you can find in silico digests of the whole proteome with Trypsin, Chymotrypsin, Trypsin+LysC, LysN, ArgC proteases suitable for different mass spec machines.| Try ESI |
 |
|---|
| ChTry ESI |
|
|---|
| ArgC ESI |
|
|---|
| LysN ESI |
|
|---|
| TryLysC ESI |
|
|---|
| Try MALDI |
|
|---|
| ChTry MALDI |
|
|---|
| ArgC MALDI |
|
|---|
| LysN MALDI |
|
|---|
| TryLysC MALDI |
|
|---|
| Try LTQ |
|
|---|
| ChTry LTQ |
|
|---|
| ArgC LTQ |
|
|---|
| LysN LTQ |
|
|---|
| TryLysC LTQ |
|
|---|
| Try MSlow |
|
|---|
| ChTry MSlow |
|
|---|
| ArgC MSlow |
|
|---|
| LysN MSlow |
|
|---|
| TryLysC MSlow |
|
|---|
| Try MShigh |
|
|---|
| ChTry MShigh |
|
|---|
| ArgC MShigh |
|
|---|
| LysN MShigh |
|
|---|
| TryLysC MShigh |
|
|---|
General Statistics
Number of major isoforms |
Number of additional isoforms |
Number of all proteins |
Number of amino acids |
Min. Seq. Length |
Max. Seq. Length |
Avg. Seq. Length |
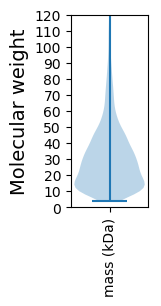
Avg. Mol. Weight |
|---|---|---|---|---|---|---|---|
0 |
1272449 |
32 |
1912 |
296.7 |
32.12 |
Amino acid frequency
Ala |
Cys |
Asp |
Glu |
Phe |
Gly |
His |
Ile |
Lys |
Leu |
|---|---|---|---|---|---|---|---|---|---|
13.189 ± 0.053 | 0.778 ± 0.012 |
6.092 ± 0.029 | 5.388 ± 0.038 |
3.519 ± 0.024 | 8.793 ± 0.037 |
2.025 ± 0.02 | 5.486 ± 0.025 |
3.07 ± 0.033 | 9.909 ± 0.045 |
Met |
Asn |
Gln |
Pro |
Arg |
Ser |
Thr |
Val |
Trp |
Tyr |
|---|---|---|---|---|---|---|---|---|---|
2.464 ± 0.018 | 2.478 ± 0.022 |
5.222 ± 0.027 | 3.025 ± 0.02 |
7.562 ± 0.04 | 5.339 ± 0.027 |
5.134 ± 0.028 | 6.907 ± 0.028 |
1.395 ± 0.015 | 2.227 ± 0.021 |
Most of the basic statistics you can see at this page can be downloaded from this CSV file
See this proteome in:

Proteome-pI is available under Creative Commons Attribution-NoDerivs license, for more details see here
| Reference: Kozlowski LP. Proteome-pI 2.0: Proteome Isoelectric Point Database Update. Nucleic Acids Res. 2021, doi: 10.1093/nar/gkab944 | Contact: Lukasz P. Kozlowski |