Lactococcus phage CHPC1182
Taxonomy: Viruses; Duplodnaviria; Heunggongvirae; Uroviricota; Caudoviricetes; Caudovirales; Siphoviridae; Ceduovirus; Lactococcus virus CHPC1182
Average proteome isoelectric point is 6.29
Get precalculated fractions of proteins
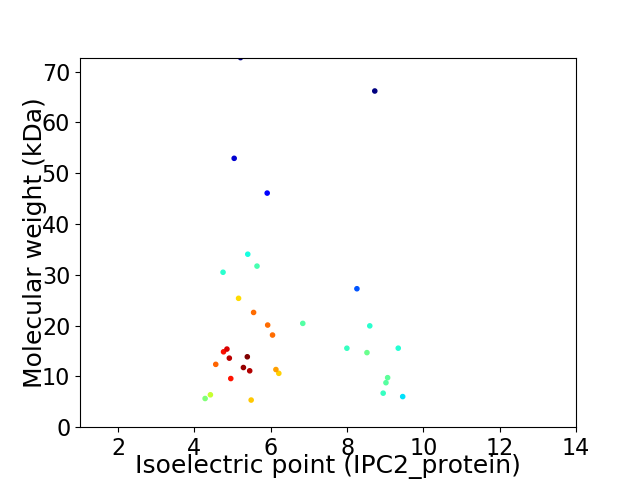
Virtual 2D-PAGE plot for 34 proteins (isoelectric point calculated using IPC2_protein)
Get csv file with sequences according to given criteria:
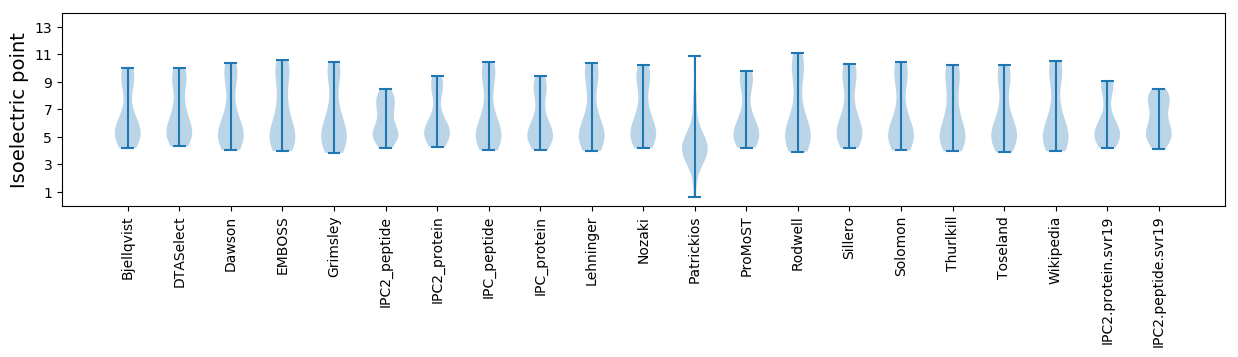
* You can choose from 21 different methods for calculating isoelectric point
Summary statistics related to proteome-wise predictions
Protein with the lowest isoelectric point:
>tr|A0A650ERU3|A0A650ERU3_9CAUD Uncharacterized protein OS=Lactococcus phage CHPC1182 OX=2675242 GN=CHPC1182_000297 PE=4 SV=1
MM1 pKa = 7.66AEE3 pKa = 3.91KK4 pKa = 10.59NIYY7 pKa = 9.19FVNDD11 pKa = 3.28EE12 pKa = 4.44VEE14 pKa = 4.24LKK16 pKa = 10.4QVLEE20 pKa = 5.19FISKK24 pKa = 8.89TDD26 pKa = 3.36YY27 pKa = 11.06GVNIDD32 pKa = 4.46KK33 pKa = 10.95SQEE36 pKa = 3.58DD37 pKa = 4.77VYY39 pKa = 11.7AVVTSYY45 pKa = 11.55SLPII49 pKa = 4.27
MM1 pKa = 7.66AEE3 pKa = 3.91KK4 pKa = 10.59NIYY7 pKa = 9.19FVNDD11 pKa = 3.28EE12 pKa = 4.44VEE14 pKa = 4.24LKK16 pKa = 10.4QVLEE20 pKa = 5.19FISKK24 pKa = 8.89TDD26 pKa = 3.36YY27 pKa = 11.06GVNIDD32 pKa = 4.46KK33 pKa = 10.95SQEE36 pKa = 3.58DD37 pKa = 4.77VYY39 pKa = 11.7AVVTSYY45 pKa = 11.55SLPII49 pKa = 4.27
Molecular weight: 5.65 kDa
Isoelectric point according different methods:
Protein with the highest isoelectric point:
>tr|A0A650F767|A0A650F767_9CAUD Endolysin OS=Lactococcus phage CHPC1182 OX=2675242 GN=CHPC1182_000289 PE=3 SV=1
MM1 pKa = 7.32LTLLLTIIFIWLAFKK16 pKa = 9.98TVEE19 pKa = 4.17NVAEE23 pKa = 3.97EE24 pKa = 4.01LGRR27 pKa = 11.84YY28 pKa = 8.37IRR30 pKa = 11.84GFLKK34 pKa = 10.2WLWKK38 pKa = 9.36MYY40 pKa = 10.08KK41 pKa = 9.59KK42 pKa = 10.12HH43 pKa = 5.87INKK46 pKa = 9.45GVSLL50 pKa = 4.02
MM1 pKa = 7.32LTLLLTIIFIWLAFKK16 pKa = 9.98TVEE19 pKa = 4.17NVAEE23 pKa = 3.97EE24 pKa = 4.01LGRR27 pKa = 11.84YY28 pKa = 8.37IRR30 pKa = 11.84GFLKK34 pKa = 10.2WLWKK38 pKa = 9.36MYY40 pKa = 10.08KK41 pKa = 9.59KK42 pKa = 10.12HH43 pKa = 5.87INKK46 pKa = 9.45GVSLL50 pKa = 4.02
Molecular weight: 6.03 kDa
Isoelectric point according different methods:
Peptides (in silico digests for buttom-up proteomics)
Below you can find in silico digests of the whole proteome with Trypsin, Chymotrypsin, Trypsin+LysC, LysN, ArgC proteases suitable for different mass spec machines.| Try ESI |
 |
|---|
| ChTry ESI |
|
|---|
| ArgC ESI |
|
|---|
| LysN ESI |
|
|---|
| TryLysC ESI |
|
|---|
| Try MALDI |
|
|---|
| ChTry MALDI |
|
|---|
| ArgC MALDI |
|
|---|
| LysN MALDI |
|
|---|
| TryLysC MALDI |
|
|---|
| Try LTQ |
|
|---|
| ChTry LTQ |
|
|---|
| ArgC LTQ |
|
|---|
| LysN LTQ |
|
|---|
| TryLysC LTQ |
|
|---|
| Try MSlow |
|
|---|
| ChTry MSlow |
|
|---|
| ArgC MSlow |
|
|---|
| LysN MSlow |
|
|---|
| TryLysC MSlow |
|
|---|
| Try MShigh |
|
|---|
| ChTry MShigh |
|
|---|
| ArgC MShigh |
|
|---|
| LysN MShigh |
|
|---|
| TryLysC MShigh |
|
|---|
General Statistics
Number of major isoforms |
Number of additional isoforms |
Number of all proteins |
Number of amino acids |
Min. Seq. Length |
Max. Seq. Length |
Avg. Seq. Length |
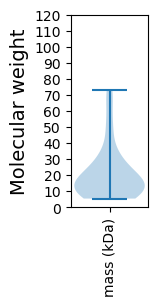
Avg. Mol. Weight |
|---|---|---|---|---|---|---|---|
0 |
6208 |
48 |
628 |
182.6 |
20.79 |
Amino acid frequency
Ala |
Cys |
Asp |
Glu |
Phe |
Gly |
His |
Ile |
Lys |
Leu |
|---|---|---|---|---|---|---|---|---|---|
5.944 ± 0.464 | 0.773 ± 0.187 |
5.928 ± 0.282 | 7.233 ± 0.5 |
4.478 ± 0.254 | 6.959 ± 0.491 |
1.466 ± 0.211 | 6.282 ± 0.453 |
8.65 ± 0.471 | 8.409 ± 0.42 |
Met |
Asn |
Gln |
Pro |
Arg |
Ser |
Thr |
Val |
Trp |
Tyr |
|---|---|---|---|---|---|---|---|---|---|
2.867 ± 0.231 | 6.765 ± 0.326 |
2.577 ± 0.4 | 4.011 ± 0.338 |
3.479 ± 0.274 | 5.718 ± 0.462 |
6.169 ± 0.309 | 6.041 ± 0.444 |
1.418 ± 0.23 | 4.832 ± 0.347 |
Most of the basic statistics you can see at this page can be downloaded from this CSV file
See this proteome in:

Proteome-pI is available under Creative Commons Attribution-NoDerivs license, for more details see here
| Reference: Kozlowski LP. Proteome-pI 2.0: Proteome Isoelectric Point Database Update. Nucleic Acids Res. 2021, doi: 10.1093/nar/gkab944 | Contact: Lukasz P. Kozlowski |