Labrys okinawensis
Taxonomy: cellular organisms; Bacteria; Proteobacteria; Alphaproteobacteria; Hyphomicrobiales; Xanthobacteraceae; Labrys
Average proteome isoelectric point is 6.7
Get precalculated fractions of proteins
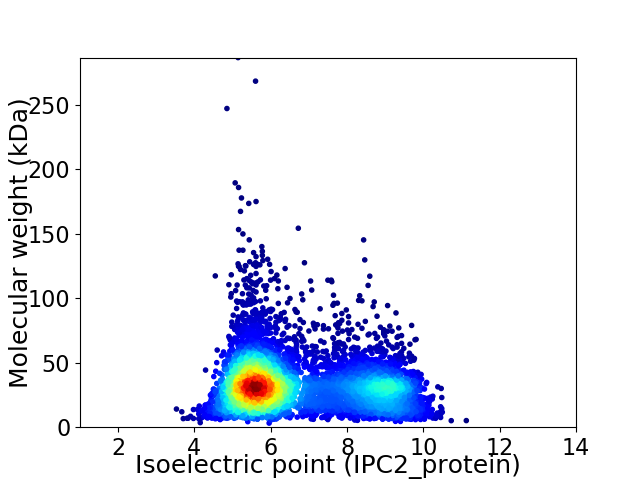
Virtual 2D-PAGE plot for 5818 proteins (isoelectric point calculated using IPC2_protein)
Get csv file with sequences according to given criteria:
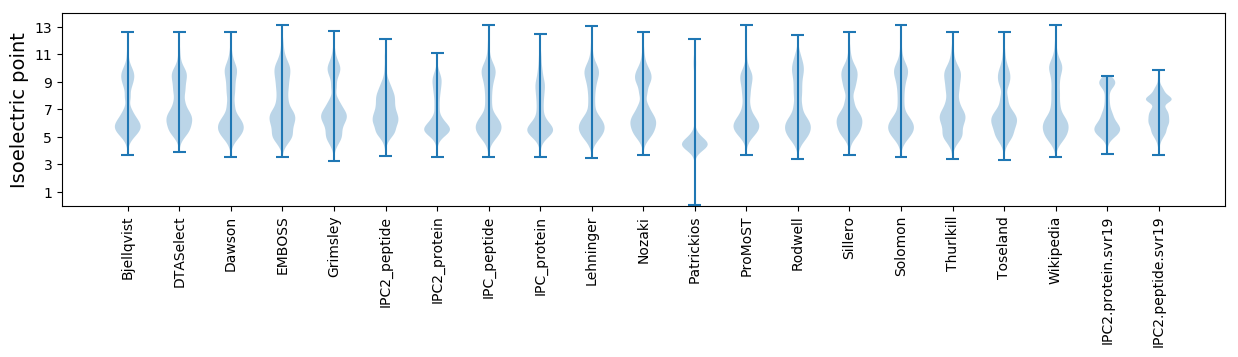
* You can choose from 21 different methods for calculating isoelectric point
Summary statistics related to proteome-wise predictions
Protein with the lowest isoelectric point:
>tr|A0A2S9Q864|A0A2S9Q864_9RHIZ Aspartate-semialdehyde dehydrogenase OS=Labrys okinawensis OX=346911 GN=asd PE=3 SV=1
MM1 pKa = 8.02PSTSDD6 pKa = 3.29EE7 pKa = 4.27VLVPSTVDD15 pKa = 2.83VHH17 pKa = 6.43SAVDD21 pKa = 3.62AQIAAQDD28 pKa = 3.76LLAALKK34 pKa = 9.26QVCADD39 pKa = 4.56HH40 pKa = 5.97YY41 pKa = 10.59QSPAVVSFPINGATVLDD58 pKa = 4.02AMAVTGNFF66 pKa = 3.22
MM1 pKa = 8.02PSTSDD6 pKa = 3.29EE7 pKa = 4.27VLVPSTVDD15 pKa = 2.83VHH17 pKa = 6.43SAVDD21 pKa = 3.62AQIAAQDD28 pKa = 3.76LLAALKK34 pKa = 9.26QVCADD39 pKa = 4.56HH40 pKa = 5.97YY41 pKa = 10.59QSPAVVSFPINGATVLDD58 pKa = 4.02AMAVTGNFF66 pKa = 3.22
Molecular weight: 6.8 kDa
Isoelectric point according different methods:
Protein with the highest isoelectric point:
>tr|A0A2S9Q406|A0A2S9Q406_9RHIZ Erythritol/L-threitol dehydrogenase OS=Labrys okinawensis OX=346911 GN=C5L14_28825 PE=3 SV=1
MM1 pKa = 7.35KK2 pKa = 9.43RR3 pKa = 11.84TYY5 pKa = 10.27QPSKK9 pKa = 9.73LVRR12 pKa = 11.84KK13 pKa = 9.15RR14 pKa = 11.84RR15 pKa = 11.84HH16 pKa = 4.55GFRR19 pKa = 11.84ARR21 pKa = 11.84LATKK25 pKa = 10.3GGRR28 pKa = 11.84KK29 pKa = 9.04VLAARR34 pKa = 11.84RR35 pKa = 11.84AHH37 pKa = 5.03GRR39 pKa = 11.84KK40 pKa = 9.3RR41 pKa = 11.84LSAA44 pKa = 4.01
MM1 pKa = 7.35KK2 pKa = 9.43RR3 pKa = 11.84TYY5 pKa = 10.27QPSKK9 pKa = 9.73LVRR12 pKa = 11.84KK13 pKa = 9.15RR14 pKa = 11.84RR15 pKa = 11.84HH16 pKa = 4.55GFRR19 pKa = 11.84ARR21 pKa = 11.84LATKK25 pKa = 10.3GGRR28 pKa = 11.84KK29 pKa = 9.04VLAARR34 pKa = 11.84RR35 pKa = 11.84AHH37 pKa = 5.03GRR39 pKa = 11.84KK40 pKa = 9.3RR41 pKa = 11.84LSAA44 pKa = 4.01
Molecular weight: 5.13 kDa
Isoelectric point according different methods:
Peptides (in silico digests for buttom-up proteomics)
Below you can find in silico digests of the whole proteome with Trypsin, Chymotrypsin, Trypsin+LysC, LysN, ArgC proteases suitable for different mass spec machines.| Try ESI |
 |
|---|
| ChTry ESI |
|
|---|
| ArgC ESI |
|
|---|
| LysN ESI |
|
|---|
| TryLysC ESI |
|
|---|
| Try MALDI |
|
|---|
| ChTry MALDI |
|
|---|
| ArgC MALDI |
|
|---|
| LysN MALDI |
|
|---|
| TryLysC MALDI |
|
|---|
| Try LTQ |
|
|---|
| ChTry LTQ |
|
|---|
| ArgC LTQ |
|
|---|
| LysN LTQ |
|
|---|
| TryLysC LTQ |
|
|---|
| Try MSlow |
|
|---|
| ChTry MSlow |
|
|---|
| ArgC MSlow |
|
|---|
| LysN MSlow |
|
|---|
| TryLysC MSlow |
|
|---|
| Try MShigh |
|
|---|
| ChTry MShigh |
|
|---|
| ArgC MShigh |
|
|---|
| LysN MShigh |
|
|---|
| TryLysC MShigh |
|
|---|
General Statistics
Number of major isoforms |
Number of additional isoforms |
Number of all proteins |
Number of amino acids |
Min. Seq. Length |
Max. Seq. Length |
Avg. Seq. Length |
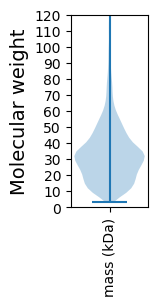
Avg. Mol. Weight |
|---|---|---|---|---|---|---|---|
0 |
1849414 |
28 |
2683 |
317.9 |
34.4 |
Amino acid frequency
Ala |
Cys |
Asp |
Glu |
Phe |
Gly |
His |
Ile |
Lys |
Leu |
|---|---|---|---|---|---|---|---|---|---|
12.914 ± 0.039 | 0.809 ± 0.01 |
5.451 ± 0.025 | 5.454 ± 0.032 |
3.776 ± 0.022 | 8.747 ± 0.028 |
2.017 ± 0.016 | 5.274 ± 0.024 |
3.292 ± 0.027 | 10.499 ± 0.045 |
Met |
Asn |
Gln |
Pro |
Arg |
Ser |
Thr |
Val |
Trp |
Tyr |
|---|---|---|---|---|---|---|---|---|---|
2.326 ± 0.012 | 2.477 ± 0.019 |
5.324 ± 0.025 | 3.13 ± 0.019 |
7.088 ± 0.041 | 5.408 ± 0.02 |
5.086 ± 0.023 | 7.307 ± 0.026 |
1.361 ± 0.013 | 2.258 ± 0.015 |
Most of the basic statistics you can see at this page can be downloaded from this CSV file
See this proteome in:

Proteome-pI is available under Creative Commons Attribution-NoDerivs license, for more details see here
| Reference: Kozlowski LP. Proteome-pI 2.0: Proteome Isoelectric Point Database Update. Nucleic Acids Res. 2021, doi: 10.1093/nar/gkab944 | Contact: Lukasz P. Kozlowski |