Pantoea phage LIMElight
Taxonomy: Viruses; Duplodnaviria; Heunggongvirae; Uroviricota; Caudoviricetes; Caudovirales; Autographiviridae; Limelightvirus; Pantoea virus Limelight
Average proteome isoelectric point is 6.63
Get precalculated fractions of proteins
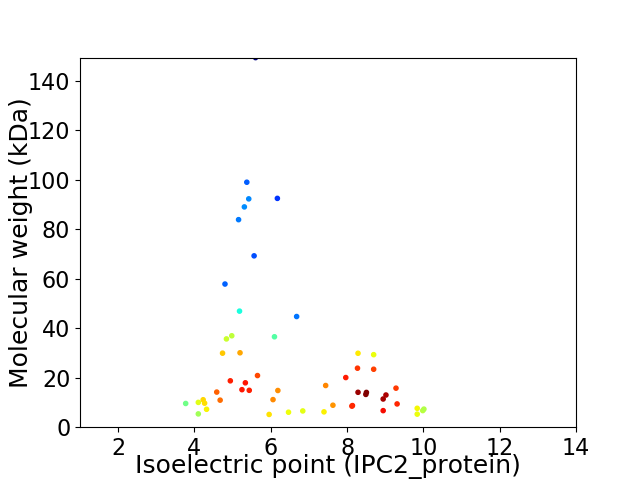
Virtual 2D-PAGE plot for 55 proteins (isoelectric point calculated using IPC2_protein)
Get csv file with sequences according to given criteria:
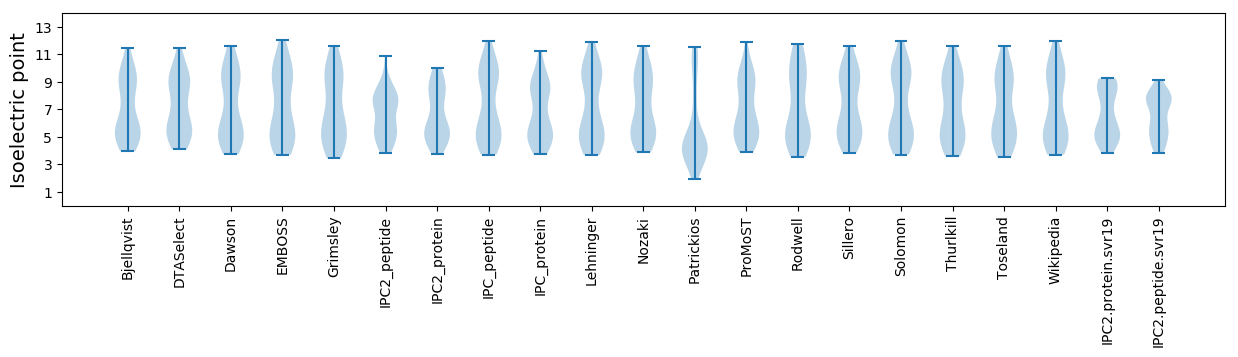
* You can choose from 21 different methods for calculating isoelectric point
Summary statistics related to proteome-wise predictions
Protein with the lowest isoelectric point:
>tr|E1Y3T0|E1Y3T0_9CAUD Putative DNA helicase OS=Pantoea phage LIMElight OX=881915 PE=4 SV=1
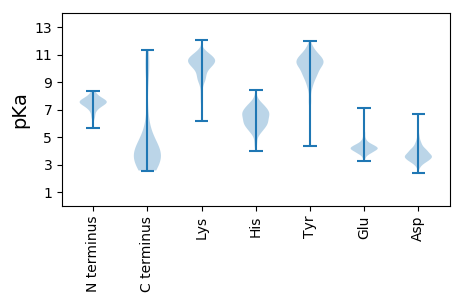
MM1 pKa = 7.5GVLQDD6 pKa = 4.18GVSIQYY12 pKa = 10.29ISDD15 pKa = 3.55EE16 pKa = 4.23FPIMEE21 pKa = 4.25MQADD25 pKa = 4.57GYY27 pKa = 10.47EE28 pKa = 4.04RR29 pKa = 11.84HH30 pKa = 6.07NLQTGEE36 pKa = 4.04VDD38 pKa = 3.6TVQPTSPTLHH48 pKa = 6.45
MM1 pKa = 7.5GVLQDD6 pKa = 4.18GVSIQYY12 pKa = 10.29ISDD15 pKa = 3.55EE16 pKa = 4.23FPIMEE21 pKa = 4.25MQADD25 pKa = 4.57GYY27 pKa = 10.47EE28 pKa = 4.04RR29 pKa = 11.84HH30 pKa = 6.07NLQTGEE36 pKa = 4.04VDD38 pKa = 3.6TVQPTSPTLHH48 pKa = 6.45
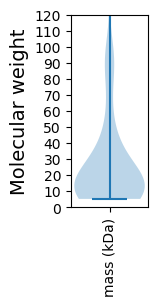
Molecular weight: 5.38 kDa
Isoelectric point according different methods:
Protein with the highest isoelectric point:
>tr|E1Y3X9|E1Y3X9_9CAUD Uncharacterized protein OS=Pantoea phage LIMElight OX=881915 PE=4 SV=1
MM1 pKa = 7.73KK2 pKa = 9.12ITRR5 pKa = 11.84RR6 pKa = 11.84HH7 pKa = 5.54IEE9 pKa = 3.76TVILVKK15 pKa = 10.67VALSVTFAAVYY26 pKa = 7.91FLPAPMAGAVGVASNLIWLWKK47 pKa = 9.13VV48 pKa = 2.9
MM1 pKa = 7.73KK2 pKa = 9.12ITRR5 pKa = 11.84RR6 pKa = 11.84HH7 pKa = 5.54IEE9 pKa = 3.76TVILVKK15 pKa = 10.67VALSVTFAAVYY26 pKa = 7.91FLPAPMAGAVGVASNLIWLWKK47 pKa = 9.13VV48 pKa = 2.9
Molecular weight: 5.28 kDa
Isoelectric point according different methods:
Peptides (in silico digests for buttom-up proteomics)
Below you can find in silico digests of the whole proteome with Trypsin, Chymotrypsin, Trypsin+LysC, LysN, ArgC proteases suitable for different mass spec machines.| Try ESI |
 |
|---|
| ChTry ESI |
|
|---|
| ArgC ESI |
|
|---|
| LysN ESI |
|
|---|
| TryLysC ESI |
|
|---|
| Try MALDI |
|
|---|
| ChTry MALDI |
|
|---|
| ArgC MALDI |
|
|---|
| LysN MALDI |
|
|---|
| TryLysC MALDI |
|
|---|
| Try LTQ |
|
|---|
| ChTry LTQ |
|
|---|
| ArgC LTQ |
|
|---|
| LysN LTQ |
|
|---|
| TryLysC LTQ |
|
|---|
| Try MSlow |
|
|---|
| ChTry MSlow |
|
|---|
| ArgC MSlow |
|
|---|
| LysN MSlow |
|
|---|
| TryLysC MSlow |
|
|---|
| Try MShigh |
|
|---|
| ChTry MShigh |
|
|---|
| ArgC MShigh |
|
|---|
| LysN MShigh |
|
|---|
| TryLysC MShigh |
|
|---|
General Statistics
Number of major isoforms |
Number of additional isoforms |
Number of all proteins |
Number of amino acids |
Min. Seq. Length |
Max. Seq. Length |
Avg. Seq. Length |
Avg. Mol. Weight |
|---|---|---|---|---|---|---|---|
0 |
13655 |
48 |
1368 |
248.3 |
27.35 |
Amino acid frequency
Ala |
Cys |
Asp |
Glu |
Phe |
Gly |
His |
Ile |
Lys |
Leu |
|---|---|---|---|---|---|---|---|---|---|
10.472 ± 0.526 | 0.879 ± 0.149 |
6.349 ± 0.321 | 5.595 ± 0.339 |
3.134 ± 0.178 | 7.711 ± 0.269 |
1.926 ± 0.154 | 4.702 ± 0.26 |
4.914 ± 0.288 | 8.1 ± 0.309 |
Met |
Asn |
Gln |
Pro |
Arg |
Ser |
Thr |
Val |
Trp |
Tyr |
|---|---|---|---|---|---|---|---|---|---|
3.171 ± 0.197 | 4.321 ± 0.301 |
3.691 ± 0.246 | 5.002 ± 0.419 |
5.763 ± 0.332 | 6.43 ± 0.287 |
6.466 ± 0.371 | 6.745 ± 0.327 |
1.296 ± 0.141 | 3.332 ± 0.167 |
Most of the basic statistics you can see at this page can be downloaded from this CSV file
See this proteome in:

Proteome-pI is available under Creative Commons Attribution-NoDerivs license, for more details see here
| Reference: Kozlowski LP. Proteome-pI 2.0: Proteome Isoelectric Point Database Update. Nucleic Acids Res. 2021, doi: 10.1093/nar/gkab944 | Contact: Lukasz P. Kozlowski |