Human T-cell leukemia virus 3 (strain Pyl43) (HTLV-3)
Taxonomy: Viruses; Riboviria; Pararnavirae; Artverviricota; Revtraviricetes; Ortervirales; Retroviridae; Orthoretrovirinae; Deltaretrovirus; Primate T-lymphotropic virus 3
Average proteome isoelectric point is 7.96
Get precalculated fractions of proteins
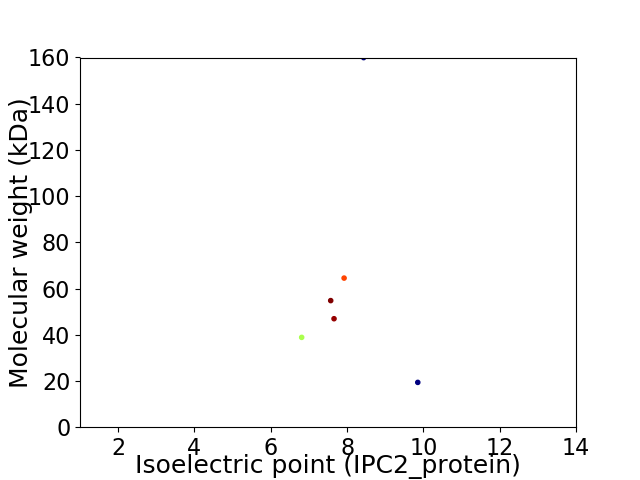
Virtual 2D-PAGE plot for 6 proteins (isoelectric point calculated using IPC2_protein)
Get csv file with sequences according to given criteria:
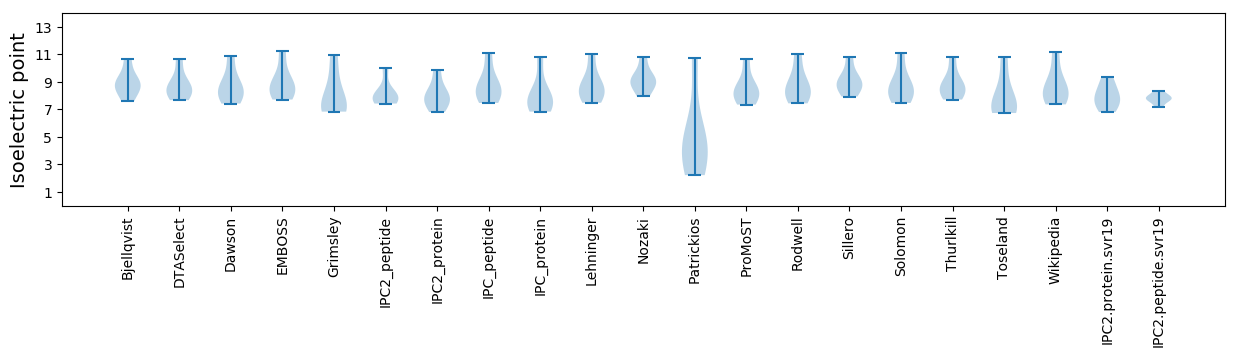
* You can choose from 21 different methods for calculating isoelectric point
Summary statistics related to proteome-wise predictions
Protein with the lowest isoelectric point:
>sp|Q4U0X7|TAX_HTL3P Protein Tax-3 OS=Human T-cell leukemia virus 3 (strain Pyl43) OX=406769 GN=tax PE=1 SV=2
MM1 pKa = 7.36AHH3 pKa = 6.69FPGFGQSLLYY13 pKa = 10.27GYY15 pKa = 9.11PVYY18 pKa = 11.22VFGDD22 pKa = 4.2CVQADD27 pKa = 3.85WCPISGGLCSARR39 pKa = 11.84LHH41 pKa = 5.8RR42 pKa = 11.84HH43 pKa = 5.65ALLATCPEE51 pKa = 4.36HH52 pKa = 7.0QITWDD57 pKa = 4.46PIDD60 pKa = 3.67GRR62 pKa = 11.84VVSSALQYY70 pKa = 9.91LIPRR74 pKa = 11.84LPSFPTQRR82 pKa = 11.84TTRR85 pKa = 11.84TLKK88 pKa = 10.79VLTPPTTATTPKK100 pKa = 9.33VPPSFFHH107 pKa = 6.74AVKK110 pKa = 10.39KK111 pKa = 8.26HH112 pKa = 4.14TPFRR116 pKa = 11.84NNCLEE121 pKa = 4.13LTLGEE126 pKa = 4.38QLPAMSFPDD135 pKa = 3.86PGLRR139 pKa = 11.84PQNVYY144 pKa = 9.05TIWGCSVVCLYY155 pKa = 10.69LYY157 pKa = 10.33QLSPPMTWPLIPHH170 pKa = 6.91VIFCHH175 pKa = 6.22PEE177 pKa = 3.45QLGAFLTRR185 pKa = 11.84VPTKK189 pKa = 10.37RR190 pKa = 11.84LEE192 pKa = 3.91EE193 pKa = 3.87LLYY196 pKa = 10.73KK197 pKa = 10.39IFLSTGAIIILPEE210 pKa = 3.89NCFPTTLFQPTRR222 pKa = 11.84APAIQAPWHH231 pKa = 6.26TGLLPCQKK239 pKa = 10.39EE240 pKa = 4.08IVTPGLIWTFTDD252 pKa = 4.92GSPMISGPCPKK263 pKa = 9.84EE264 pKa = 3.91GQPSLVVQSSTFIFQQFQTKK284 pKa = 9.91ASHH287 pKa = 6.24PAFLLSHH294 pKa = 7.07KK295 pKa = 9.91LIQYY299 pKa = 10.48SSFHH303 pKa = 6.19SLHH306 pKa = 6.64LLFEE310 pKa = 4.97EE311 pKa = 5.02YY312 pKa = 9.69STVPFSLLFNEE323 pKa = 4.62KK324 pKa = 9.75GANVSDD330 pKa = 3.96DD331 pKa = 3.89EE332 pKa = 4.62PRR334 pKa = 11.84GGPQPPTGGQIAEE347 pKa = 4.3SSVV350 pKa = 2.9
MM1 pKa = 7.36AHH3 pKa = 6.69FPGFGQSLLYY13 pKa = 10.27GYY15 pKa = 9.11PVYY18 pKa = 11.22VFGDD22 pKa = 4.2CVQADD27 pKa = 3.85WCPISGGLCSARR39 pKa = 11.84LHH41 pKa = 5.8RR42 pKa = 11.84HH43 pKa = 5.65ALLATCPEE51 pKa = 4.36HH52 pKa = 7.0QITWDD57 pKa = 4.46PIDD60 pKa = 3.67GRR62 pKa = 11.84VVSSALQYY70 pKa = 9.91LIPRR74 pKa = 11.84LPSFPTQRR82 pKa = 11.84TTRR85 pKa = 11.84TLKK88 pKa = 10.79VLTPPTTATTPKK100 pKa = 9.33VPPSFFHH107 pKa = 6.74AVKK110 pKa = 10.39KK111 pKa = 8.26HH112 pKa = 4.14TPFRR116 pKa = 11.84NNCLEE121 pKa = 4.13LTLGEE126 pKa = 4.38QLPAMSFPDD135 pKa = 3.86PGLRR139 pKa = 11.84PQNVYY144 pKa = 9.05TIWGCSVVCLYY155 pKa = 10.69LYY157 pKa = 10.33QLSPPMTWPLIPHH170 pKa = 6.91VIFCHH175 pKa = 6.22PEE177 pKa = 3.45QLGAFLTRR185 pKa = 11.84VPTKK189 pKa = 10.37RR190 pKa = 11.84LEE192 pKa = 3.91EE193 pKa = 3.87LLYY196 pKa = 10.73KK197 pKa = 10.39IFLSTGAIIILPEE210 pKa = 3.89NCFPTTLFQPTRR222 pKa = 11.84APAIQAPWHH231 pKa = 6.26TGLLPCQKK239 pKa = 10.39EE240 pKa = 4.08IVTPGLIWTFTDD252 pKa = 4.92GSPMISGPCPKK263 pKa = 9.84EE264 pKa = 3.91GQPSLVVQSSTFIFQQFQTKK284 pKa = 9.91ASHH287 pKa = 6.24PAFLLSHH294 pKa = 7.07KK295 pKa = 9.91LIQYY299 pKa = 10.48SSFHH303 pKa = 6.19SLHH306 pKa = 6.64LLFEE310 pKa = 4.97EE311 pKa = 5.02YY312 pKa = 9.69STVPFSLLFNEE323 pKa = 4.62KK324 pKa = 9.75GANVSDD330 pKa = 3.96DD331 pKa = 3.89EE332 pKa = 4.62PRR334 pKa = 11.84GGPQPPTGGQIAEE347 pKa = 4.3SSVV350 pKa = 2.9
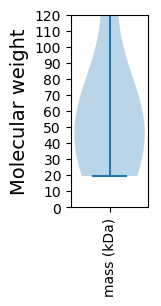
Molecular weight: 38.87 kDa
Isoelectric point according different methods:
Protein with the highest isoelectric point:
>sp|Q09SZ9|PRO_HTL3P Gag-Pro polyprotein OS=Human T-cell leukemia virus 3 (strain Pyl43) OX=406769 GN=gag-pro PE=3 SV=3
MM1 pKa = 7.86PKK3 pKa = 8.98TRR5 pKa = 11.84KK6 pKa = 8.8QRR8 pKa = 11.84SRR10 pKa = 11.84RR11 pKa = 11.84PRR13 pKa = 11.84NQRR16 pKa = 11.84PSTPWPISQVSDD28 pKa = 3.26RR29 pKa = 11.84AFSTGTLSTFSATVYY44 pKa = 10.41RR45 pKa = 11.84PIGAPFLGGFVPLGYY60 pKa = 8.38TAMPCWPRR68 pKa = 11.84APNIRR73 pKa = 11.84LPGTPSMDD81 pKa = 3.3ALSAQLYY88 pKa = 7.05NTLSLGSPPSPPKK101 pKa = 10.05EE102 pKa = 3.85LPAPSRR108 pKa = 11.84FSPPQPLLRR117 pKa = 11.84PPRR120 pKa = 11.84FLHH123 pKa = 6.85PSSTPLKK130 pKa = 8.45NTPPSEE136 pKa = 4.57TIASSSPWEE145 pKa = 4.52SSCQPCPSPTLGSGPKK161 pKa = 9.52TSTPYY166 pKa = 10.5GAAPSCVSTSISSPPPP182 pKa = 3.48
MM1 pKa = 7.86PKK3 pKa = 8.98TRR5 pKa = 11.84KK6 pKa = 8.8QRR8 pKa = 11.84SRR10 pKa = 11.84RR11 pKa = 11.84PRR13 pKa = 11.84NQRR16 pKa = 11.84PSTPWPISQVSDD28 pKa = 3.26RR29 pKa = 11.84AFSTGTLSTFSATVYY44 pKa = 10.41RR45 pKa = 11.84PIGAPFLGGFVPLGYY60 pKa = 8.38TAMPCWPRR68 pKa = 11.84APNIRR73 pKa = 11.84LPGTPSMDD81 pKa = 3.3ALSAQLYY88 pKa = 7.05NTLSLGSPPSPPKK101 pKa = 10.05EE102 pKa = 3.85LPAPSRR108 pKa = 11.84FSPPQPLLRR117 pKa = 11.84PPRR120 pKa = 11.84FLHH123 pKa = 6.85PSSTPLKK130 pKa = 8.45NTPPSEE136 pKa = 4.57TIASSSPWEE145 pKa = 4.52SSCQPCPSPTLGSGPKK161 pKa = 9.52TSTPYY166 pKa = 10.5GAAPSCVSTSISSPPPP182 pKa = 3.48
Molecular weight: 19.39 kDa
Isoelectric point according different methods:
Peptides (in silico digests for buttom-up proteomics)
Below you can find in silico digests of the whole proteome with Trypsin, Chymotrypsin, Trypsin+LysC, LysN, ArgC proteases suitable for different mass spec machines.| Try ESI |
 |
|---|
| ChTry ESI |
|
|---|
| ArgC ESI |
|
|---|
| LysN ESI |
|
|---|
| TryLysC ESI |
|
|---|
| Try MALDI |
|
|---|
| ChTry MALDI |
|
|---|
| ArgC MALDI |
|
|---|
| LysN MALDI |
|
|---|
| TryLysC MALDI |
|
|---|
| Try LTQ |
|
|---|
| ChTry LTQ |
|
|---|
| ArgC LTQ |
|
|---|
| LysN LTQ |
|
|---|
| TryLysC LTQ |
|
|---|
| Try MSlow |
|
|---|
| ChTry MSlow |
|
|---|
| ArgC MSlow |
|
|---|
| LysN MSlow |
|
|---|
| TryLysC MSlow |
|
|---|
| Try MShigh |
|
|---|
| ChTry MShigh |
|
|---|
| ArgC MShigh |
|
|---|
| LysN MShigh |
|
|---|
| TryLysC MShigh |
|
|---|
General Statistics
Number of major isoforms |
Number of additional isoforms |
Number of all proteins |
Number of amino acids |
Min. Seq. Length |
Max. Seq. Length |
Avg. Seq. Length |
Avg. Mol. Weight |
|---|---|---|---|---|---|---|---|
0 |
3471 |
182 |
1440 |
578.5 |
64.07 |
Amino acid frequency
Ala |
Cys |
Asp |
Glu |
Phe |
Gly |
His |
Ile |
Lys |
Leu |
|---|---|---|---|---|---|---|---|---|---|
6.886 ± 0.423 | 2.593 ± 0.251 |
3.688 ± 0.39 | 3.198 ± 0.318 |
3.083 ± 0.545 | 5.272 ± 0.182 |
3.515 ± 0.429 | 4.811 ± 0.443 |
4.264 ± 0.384 | 12.388 ± 0.783 |
Met |
Asn |
Gln |
Pro |
Arg |
Ser |
Thr |
Val |
Trp |
Tyr |
|---|---|---|---|---|---|---|---|---|---|
0.835 ± 0.165 | 3.601 ± 0.383 |
11.639 ± 1.277 | 6.828 ± 0.548 |
4.667 ± 0.252 | 8.096 ± 1.012 |
5.82 ± 0.578 | 4.408 ± 0.287 |
1.901 ± 0.141 | 2.506 ± 0.279 |
Most of the basic statistics you can see at this page can be downloaded from this CSV file
See this proteome in:

Proteome-pI is available under Creative Commons Attribution-NoDerivs license, for more details see here
| Reference: Kozlowski LP. Proteome-pI 2.0: Proteome Isoelectric Point Database Update. Nucleic Acids Res. 2021, doi: 10.1093/nar/gkab944 | Contact: Lukasz P. Kozlowski |