Ensifer sp. MPMI2T
Taxonomy: cellular organisms; Bacteria; Proteobacteria; Alphaproteobacteria; Hyphomicrobiales; Rhizobiaceae; Sinorhizobium/Ensifer group; Ensifer; unclassified Ensifer
Average proteome isoelectric point is 6.49
Get precalculated fractions of proteins
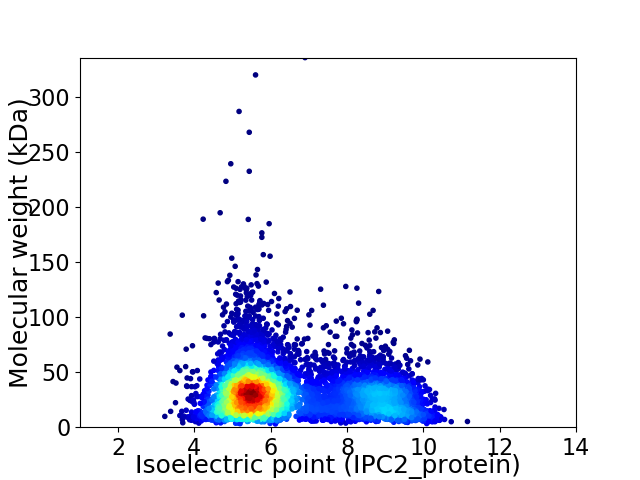
Virtual 2D-PAGE plot for 6911 proteins (isoelectric point calculated using IPC2_protein)
Get csv file with sequences according to given criteria:
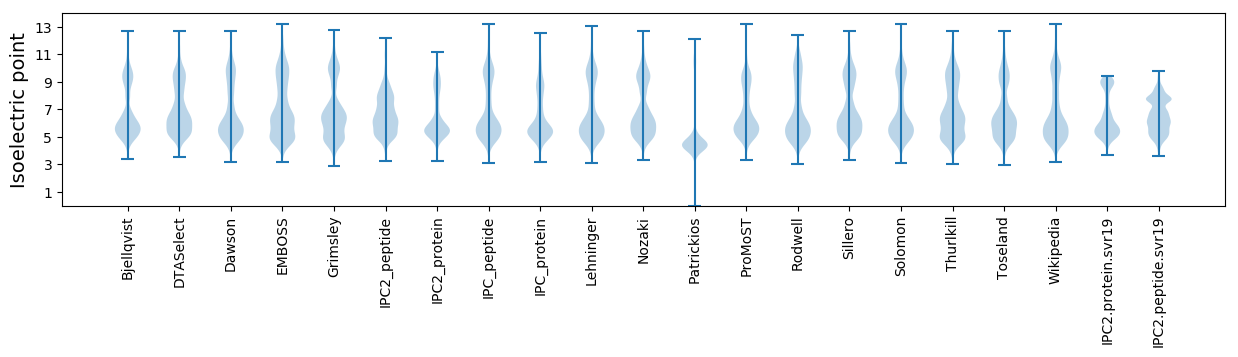
* You can choose from 21 different methods for calculating isoelectric point
Summary statistics related to proteome-wise predictions
Protein with the lowest isoelectric point:
>tr|A0A4S5JCB4|A0A4S5JCB4_9RHIZ Cytochrome c oxidase subunit 3 family protein OS=Ensifer sp. MPMI2T OX=2490847 GN=EHS39_12555 PE=3 SV=1
MM1 pKa = 7.44ATRR4 pKa = 11.84IYY6 pKa = 8.54GTNYY10 pKa = 9.5SDD12 pKa = 5.67KK13 pKa = 10.26IVQNGYY19 pKa = 10.13ISVEE23 pKa = 3.81IYY25 pKa = 11.03ALDD28 pKa = 4.18GNDD31 pKa = 3.53QIHH34 pKa = 7.03LNRR37 pKa = 11.84TDD39 pKa = 3.22SYY41 pKa = 11.54GGYY44 pKa = 9.83NFVDD48 pKa = 3.03AGYY51 pKa = 11.09GNDD54 pKa = 3.06VVVNYY59 pKa = 9.75FEE61 pKa = 4.84GGNDD65 pKa = 2.82IFMGAGDD72 pKa = 4.81DD73 pKa = 5.36LYY75 pKa = 10.78IADD78 pKa = 4.12ARR80 pKa = 11.84VRR82 pKa = 11.84DD83 pKa = 3.73ASSYY87 pKa = 9.79DD88 pKa = 3.43VVYY91 pKa = 10.64GGSGNDD97 pKa = 2.84RR98 pKa = 11.84FEE100 pKa = 5.38IEE102 pKa = 4.72TYY104 pKa = 10.89ASDD107 pKa = 4.2YY108 pKa = 11.31YY109 pKa = 11.33GDD111 pKa = 4.02SGNDD115 pKa = 3.1TFLSVGFKK123 pKa = 10.85NYY125 pKa = 10.11FNGGTGIDD133 pKa = 3.73TISYY137 pKa = 9.68QLQDD141 pKa = 2.92SFGSEE146 pKa = 3.75RR147 pKa = 11.84GRR149 pKa = 11.84GVTIDD154 pKa = 4.24LGYY157 pKa = 10.82KK158 pKa = 9.79YY159 pKa = 9.96ATTGTGRR166 pKa = 11.84RR167 pKa = 11.84EE168 pKa = 3.75DD169 pKa = 4.38LISIEE174 pKa = 4.21NATGTNYY181 pKa = 10.62GNDD184 pKa = 4.77DD185 pKa = 3.4ITGSSVANVLRR196 pKa = 11.84GLGGHH201 pKa = 7.53DD202 pKa = 3.09ILEE205 pKa = 4.52GLGGDD210 pKa = 4.31DD211 pKa = 5.01FLDD214 pKa = 4.38GGSGDD219 pKa = 4.1DD220 pKa = 4.32DD221 pKa = 5.55LYY223 pKa = 11.4GGSGADD229 pKa = 3.28ILRR232 pKa = 11.84GGTGFDD238 pKa = 3.83YY239 pKa = 11.39LNGGTGTDD247 pKa = 3.1SFDD250 pKa = 3.78FNSISEE256 pKa = 4.45SAVGSRR262 pKa = 11.84RR263 pKa = 11.84DD264 pKa = 3.62VIADD268 pKa = 3.52FHH270 pKa = 7.27RR271 pKa = 11.84SEE273 pKa = 4.18WDD275 pKa = 3.64VIDD278 pKa = 5.72LSTIDD283 pKa = 6.04ADD285 pKa = 4.42TTWSGNQSFTFIGSRR300 pKa = 11.84GFSGEE305 pKa = 3.84AGEE308 pKa = 4.73LNFRR312 pKa = 11.84YY313 pKa = 9.94GVVSGDD319 pKa = 3.45INGDD323 pKa = 3.44GYY325 pKa = 11.79ADD327 pKa = 3.67FQIKK331 pKa = 10.08VNGVTSLRR339 pKa = 11.84VDD341 pKa = 3.74DD342 pKa = 5.5FFLL345 pKa = 5.77
MM1 pKa = 7.44ATRR4 pKa = 11.84IYY6 pKa = 8.54GTNYY10 pKa = 9.5SDD12 pKa = 5.67KK13 pKa = 10.26IVQNGYY19 pKa = 10.13ISVEE23 pKa = 3.81IYY25 pKa = 11.03ALDD28 pKa = 4.18GNDD31 pKa = 3.53QIHH34 pKa = 7.03LNRR37 pKa = 11.84TDD39 pKa = 3.22SYY41 pKa = 11.54GGYY44 pKa = 9.83NFVDD48 pKa = 3.03AGYY51 pKa = 11.09GNDD54 pKa = 3.06VVVNYY59 pKa = 9.75FEE61 pKa = 4.84GGNDD65 pKa = 2.82IFMGAGDD72 pKa = 4.81DD73 pKa = 5.36LYY75 pKa = 10.78IADD78 pKa = 4.12ARR80 pKa = 11.84VRR82 pKa = 11.84DD83 pKa = 3.73ASSYY87 pKa = 9.79DD88 pKa = 3.43VVYY91 pKa = 10.64GGSGNDD97 pKa = 2.84RR98 pKa = 11.84FEE100 pKa = 5.38IEE102 pKa = 4.72TYY104 pKa = 10.89ASDD107 pKa = 4.2YY108 pKa = 11.31YY109 pKa = 11.33GDD111 pKa = 4.02SGNDD115 pKa = 3.1TFLSVGFKK123 pKa = 10.85NYY125 pKa = 10.11FNGGTGIDD133 pKa = 3.73TISYY137 pKa = 9.68QLQDD141 pKa = 2.92SFGSEE146 pKa = 3.75RR147 pKa = 11.84GRR149 pKa = 11.84GVTIDD154 pKa = 4.24LGYY157 pKa = 10.82KK158 pKa = 9.79YY159 pKa = 9.96ATTGTGRR166 pKa = 11.84RR167 pKa = 11.84EE168 pKa = 3.75DD169 pKa = 4.38LISIEE174 pKa = 4.21NATGTNYY181 pKa = 10.62GNDD184 pKa = 4.77DD185 pKa = 3.4ITGSSVANVLRR196 pKa = 11.84GLGGHH201 pKa = 7.53DD202 pKa = 3.09ILEE205 pKa = 4.52GLGGDD210 pKa = 4.31DD211 pKa = 5.01FLDD214 pKa = 4.38GGSGDD219 pKa = 4.1DD220 pKa = 4.32DD221 pKa = 5.55LYY223 pKa = 11.4GGSGADD229 pKa = 3.28ILRR232 pKa = 11.84GGTGFDD238 pKa = 3.83YY239 pKa = 11.39LNGGTGTDD247 pKa = 3.1SFDD250 pKa = 3.78FNSISEE256 pKa = 4.45SAVGSRR262 pKa = 11.84RR263 pKa = 11.84DD264 pKa = 3.62VIADD268 pKa = 3.52FHH270 pKa = 7.27RR271 pKa = 11.84SEE273 pKa = 4.18WDD275 pKa = 3.64VIDD278 pKa = 5.72LSTIDD283 pKa = 6.04ADD285 pKa = 4.42TTWSGNQSFTFIGSRR300 pKa = 11.84GFSGEE305 pKa = 3.84AGEE308 pKa = 4.73LNFRR312 pKa = 11.84YY313 pKa = 9.94GVVSGDD319 pKa = 3.45INGDD323 pKa = 3.44GYY325 pKa = 11.79ADD327 pKa = 3.67FQIKK331 pKa = 10.08VNGVTSLRR339 pKa = 11.84VDD341 pKa = 3.74DD342 pKa = 5.5FFLL345 pKa = 5.77
Molecular weight: 37.01 kDa
Isoelectric point according different methods:
Protein with the highest isoelectric point:
>tr|A0A4S5JEC3|A0A4S5JEC3_9RHIZ Proline/glycine betaine ABC transporter permease OS=Ensifer sp. MPMI2T OX=2490847 GN=EHS39_00570 PE=3 SV=1
MM1 pKa = 7.35KK2 pKa = 9.43RR3 pKa = 11.84TYY5 pKa = 10.27QPSKK9 pKa = 9.73LVRR12 pKa = 11.84KK13 pKa = 9.15RR14 pKa = 11.84RR15 pKa = 11.84HH16 pKa = 4.46GFRR19 pKa = 11.84ARR21 pKa = 11.84MSTKK25 pKa = 10.15GGRR28 pKa = 11.84KK29 pKa = 8.78VLAARR34 pKa = 11.84RR35 pKa = 11.84ARR37 pKa = 11.84GRR39 pKa = 11.84KK40 pKa = 9.03RR41 pKa = 11.84LSAA44 pKa = 4.03
MM1 pKa = 7.35KK2 pKa = 9.43RR3 pKa = 11.84TYY5 pKa = 10.27QPSKK9 pKa = 9.73LVRR12 pKa = 11.84KK13 pKa = 9.15RR14 pKa = 11.84RR15 pKa = 11.84HH16 pKa = 4.46GFRR19 pKa = 11.84ARR21 pKa = 11.84MSTKK25 pKa = 10.15GGRR28 pKa = 11.84KK29 pKa = 8.78VLAARR34 pKa = 11.84RR35 pKa = 11.84ARR37 pKa = 11.84GRR39 pKa = 11.84KK40 pKa = 9.03RR41 pKa = 11.84LSAA44 pKa = 4.03
Molecular weight: 5.18 kDa
Isoelectric point according different methods:
Peptides (in silico digests for buttom-up proteomics)
Below you can find in silico digests of the whole proteome with Trypsin, Chymotrypsin, Trypsin+LysC, LysN, ArgC proteases suitable for different mass spec machines.| Try ESI |
 |
|---|
| ChTry ESI |
|
|---|
| ArgC ESI |
|
|---|
| LysN ESI |
|
|---|
| TryLysC ESI |
|
|---|
| Try MALDI |
|
|---|
| ChTry MALDI |
|
|---|
| ArgC MALDI |
|
|---|
| LysN MALDI |
|
|---|
| TryLysC MALDI |
|
|---|
| Try LTQ |
|
|---|
| ChTry LTQ |
|
|---|
| ArgC LTQ |
|
|---|
| LysN LTQ |
|
|---|
| TryLysC LTQ |
|
|---|
| Try MSlow |
|
|---|
| ChTry MSlow |
|
|---|
| ArgC MSlow |
|
|---|
| LysN MSlow |
|
|---|
| TryLysC MSlow |
|
|---|
| Try MShigh |
|
|---|
| ChTry MShigh |
|
|---|
| ArgC MShigh |
|
|---|
| LysN MShigh |
|
|---|
| TryLysC MShigh |
|
|---|
General Statistics
Number of major isoforms |
Number of additional isoforms |
Number of all proteins |
Number of amino acids |
Min. Seq. Length |
Max. Seq. Length |
Avg. Seq. Length |
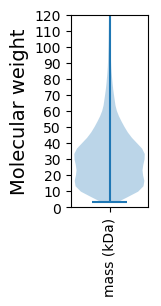
Avg. Mol. Weight |
|---|---|---|---|---|---|---|---|
0 |
2097564 |
28 |
3083 |
303.5 |
33.1 |
Amino acid frequency
Ala |
Cys |
Asp |
Glu |
Phe |
Gly |
His |
Ile |
Lys |
Leu |
|---|---|---|---|---|---|---|---|---|---|
11.988 ± 0.036 | 0.862 ± 0.008 |
5.607 ± 0.023 | 6.059 ± 0.027 |
3.905 ± 0.018 | 8.241 ± 0.03 |
2.084 ± 0.015 | 5.494 ± 0.019 |
3.556 ± 0.024 | 9.951 ± 0.032 |
Met |
Asn |
Gln |
Pro |
Arg |
Ser |
Thr |
Val |
Trp |
Tyr |
|---|---|---|---|---|---|---|---|---|---|
2.468 ± 0.012 | 2.789 ± 0.016 |
4.95 ± 0.021 | 3.022 ± 0.017 |
7.118 ± 0.032 | 5.688 ± 0.023 |
5.224 ± 0.022 | 7.356 ± 0.022 |
1.324 ± 0.011 | 2.314 ± 0.014 |
Most of the basic statistics you can see at this page can be downloaded from this CSV file
See this proteome in:

Proteome-pI is available under Creative Commons Attribution-NoDerivs license, for more details see here
| Reference: Kozlowski LP. Proteome-pI 2.0: Proteome Isoelectric Point Database Update. Nucleic Acids Res. 2021, doi: 10.1093/nar/gkab944 | Contact: Lukasz P. Kozlowski |