Streptococcus phage P7573
Taxonomy: Viruses; Duplodnaviria; Heunggongvirae; Uroviricota; Caudoviricetes; Caudovirales; Siphoviridae; Moineauvirus; unclassified Moineauvirus
Average proteome isoelectric point is 6.83
Get precalculated fractions of proteins
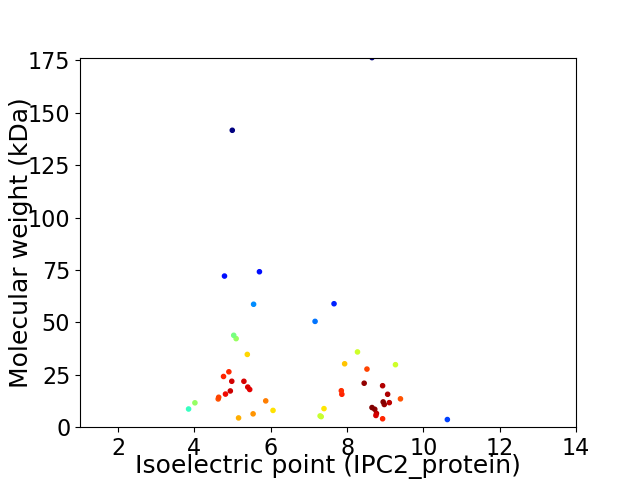
Virtual 2D-PAGE plot for 48 proteins (isoelectric point calculated using IPC2_protein)
Get csv file with sequences according to given criteria:
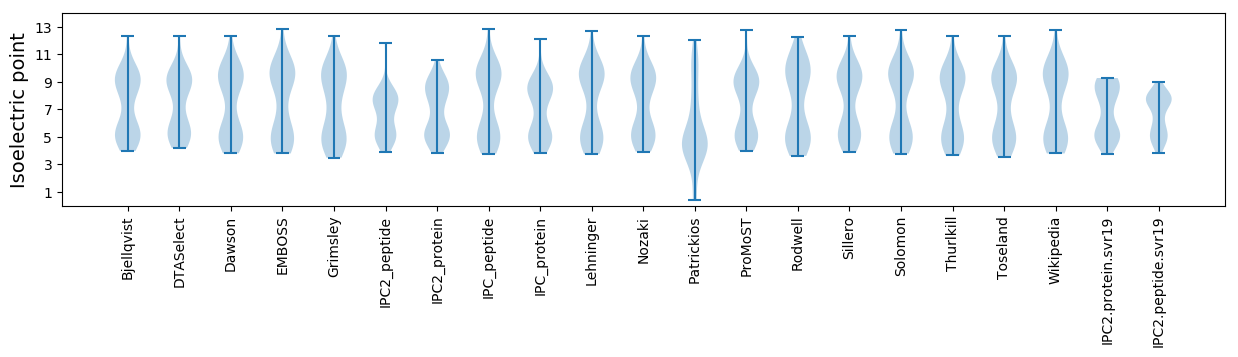
* You can choose from 21 different methods for calculating isoelectric point
Summary statistics related to proteome-wise predictions
Protein with the lowest isoelectric point:
>tr|A0A286QPL1|A0A286QPL1_9CAUD Tape measure protein OS=Streptococcus phage P7573 OX=1971429 GN=P7573_15 PE=4 SV=1
MM1 pKa = 7.12VNWVDD6 pKa = 4.58KK7 pKa = 11.1DD8 pKa = 4.24GNDD11 pKa = 3.97LPDD14 pKa = 4.77GADD17 pKa = 3.18QDD19 pKa = 4.63FKK21 pKa = 11.75AGMFFSFAGDD31 pKa = 3.56EE32 pKa = 4.15NNITDD37 pKa = 3.82TGEE40 pKa = 3.65GGYY43 pKa = 10.61YY44 pKa = 9.76GGYY47 pKa = 8.0YY48 pKa = 9.41YY49 pKa = 10.76RR50 pKa = 11.84RR51 pKa = 11.84FEE53 pKa = 4.06FGQFGTVWLSCWNKK67 pKa = 10.66DD68 pKa = 3.89DD69 pKa = 5.14LVNYY73 pKa = 7.38YY74 pKa = 8.26QQ75 pKa = 4.22
MM1 pKa = 7.12VNWVDD6 pKa = 4.58KK7 pKa = 11.1DD8 pKa = 4.24GNDD11 pKa = 3.97LPDD14 pKa = 4.77GADD17 pKa = 3.18QDD19 pKa = 4.63FKK21 pKa = 11.75AGMFFSFAGDD31 pKa = 3.56EE32 pKa = 4.15NNITDD37 pKa = 3.82TGEE40 pKa = 3.65GGYY43 pKa = 10.61YY44 pKa = 9.76GGYY47 pKa = 8.0YY48 pKa = 9.41YY49 pKa = 10.76RR50 pKa = 11.84RR51 pKa = 11.84FEE53 pKa = 4.06FGQFGTVWLSCWNKK67 pKa = 10.66DD68 pKa = 3.89DD69 pKa = 5.14LVNYY73 pKa = 7.38YY74 pKa = 8.26QQ75 pKa = 4.22
Molecular weight: 8.68 kDa
Isoelectric point according different methods:
Protein with the highest isoelectric point:
>tr|A0A286QPM9|A0A286QPM9_9CAUD Uncharacterized protein OS=Streptococcus phage P7573 OX=1971429 GN=P7573_47 PE=4 SV=1
MM1 pKa = 7.84ASFRR5 pKa = 11.84LNSRR9 pKa = 11.84TVTSTFSRR17 pKa = 11.84GFLFLQKK24 pKa = 9.04KK25 pKa = 7.7TKK27 pKa = 9.94FLNKK31 pKa = 10.08
MM1 pKa = 7.84ASFRR5 pKa = 11.84LNSRR9 pKa = 11.84TVTSTFSRR17 pKa = 11.84GFLFLQKK24 pKa = 9.04KK25 pKa = 7.7TKK27 pKa = 9.94FLNKK31 pKa = 10.08
Molecular weight: 3.66 kDa
Isoelectric point according different methods:
Peptides (in silico digests for buttom-up proteomics)
Below you can find in silico digests of the whole proteome with Trypsin, Chymotrypsin, Trypsin+LysC, LysN, ArgC proteases suitable for different mass spec machines.| Try ESI |
 |
|---|
| ChTry ESI |
|
|---|
| ArgC ESI |
|
|---|
| LysN ESI |
|
|---|
| TryLysC ESI |
|
|---|
| Try MALDI |
|
|---|
| ChTry MALDI |
|
|---|
| ArgC MALDI |
|
|---|
| LysN MALDI |
|
|---|
| TryLysC MALDI |
|
|---|
| Try LTQ |
|
|---|
| ChTry LTQ |
|
|---|
| ArgC LTQ |
|
|---|
| LysN LTQ |
|
|---|
| TryLysC LTQ |
|
|---|
| Try MSlow |
|
|---|
| ChTry MSlow |
|
|---|
| ArgC MSlow |
|
|---|
| LysN MSlow |
|
|---|
| TryLysC MSlow |
|
|---|
| Try MShigh |
|
|---|
| ChTry MShigh |
|
|---|
| ArgC MShigh |
|
|---|
| LysN MShigh |
|
|---|
| TryLysC MShigh |
|
|---|
General Statistics
Number of major isoforms |
Number of additional isoforms |
Number of all proteins |
Number of amino acids |
Min. Seq. Length |
Max. Seq. Length |
Avg. Seq. Length |
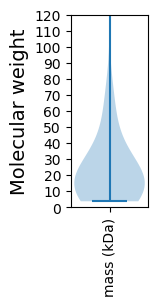
Avg. Mol. Weight |
|---|---|---|---|---|---|---|---|
0 |
11613 |
31 |
1602 |
241.9 |
27.41 |
Amino acid frequency
Ala |
Cys |
Asp |
Glu |
Phe |
Gly |
His |
Ile |
Lys |
Leu |
|---|---|---|---|---|---|---|---|---|---|
6.054 ± 0.502 | 0.646 ± 0.172 |
6.467 ± 0.211 | 6.544 ± 0.442 |
4.159 ± 0.254 | 6.872 ± 0.563 |
1.438 ± 0.105 | 6.665 ± 0.25 |
8.542 ± 0.568 | 7.948 ± 0.409 |
Met |
Asn |
Gln |
Pro |
Arg |
Ser |
Thr |
Val |
Trp |
Tyr |
|---|---|---|---|---|---|---|---|---|---|
2.506 ± 0.156 | 6.381 ± 0.254 |
3.022 ± 0.222 | 4.03 ± 0.188 |
4.4 ± 0.289 | 6.45 ± 0.361 |
6.226 ± 0.347 | 6.166 ± 0.195 |
1.455 ± 0.172 | 4.03 ± 0.31 |
Most of the basic statistics you can see at this page can be downloaded from this CSV file
See this proteome in:

Proteome-pI is available under Creative Commons Attribution-NoDerivs license, for more details see here
| Reference: Kozlowski LP. Proteome-pI 2.0: Proteome Isoelectric Point Database Update. Nucleic Acids Res. 2021, doi: 10.1093/nar/gkab944 | Contact: Lukasz P. Kozlowski |