Human immunodeficiency virus type 1 group M subtype D (isolate ELI) (HIV-1)
Taxonomy: Viruses; Riboviria; Pararnavirae; Artverviricota; Revtraviricetes; Ortervirales; Retroviridae; Orthoretrovirinae; Lentivirus; Human immunodeficiency virus 1; HIV-1 unknown group
Average proteome isoelectric point is 7.92
Get precalculated fractions of proteins
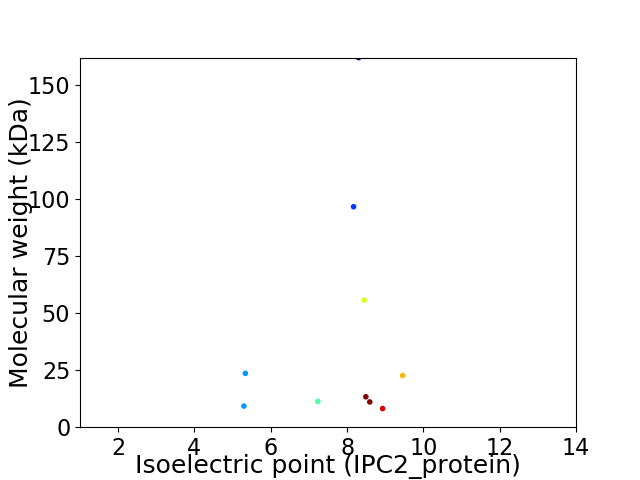
Virtual 2D-PAGE plot for 10 proteins (isoelectric point calculated using IPC2_protein)
Get csv file with sequences according to given criteria:
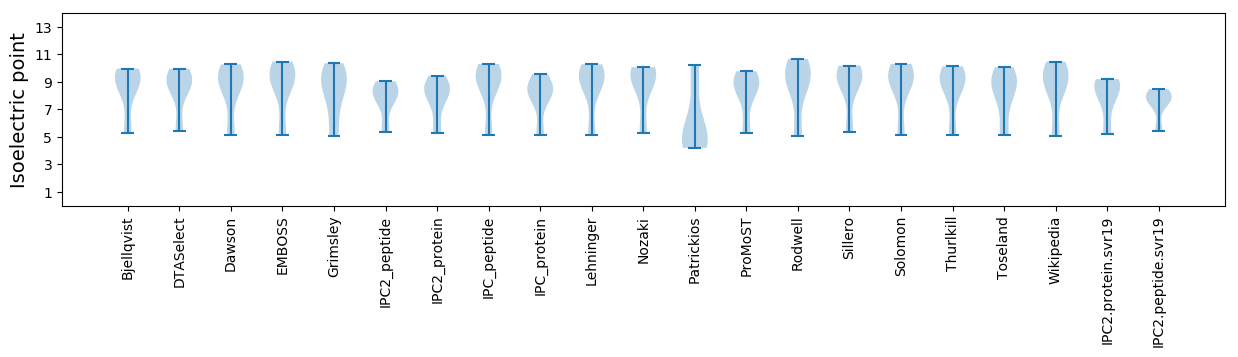
* You can choose from 21 different methods for calculating isoelectric point
Summary statistics related to proteome-wise predictions
Protein with the lowest isoelectric point:
>sp|P05956|VPR_HV1EL Protein Vpr OS=Human immunodeficiency virus type 1 group M subtype D (isolate ELI) OX=11689 GN=vpr PE=3 SV=1
MM1 pKa = 7.14QPLGIIAIAALVVAIILAIVVWTIVFIEE29 pKa = 3.8YY30 pKa = 10.32RR31 pKa = 11.84RR32 pKa = 11.84IKK34 pKa = 8.69KK35 pKa = 8.34QRR37 pKa = 11.84RR38 pKa = 11.84IDD40 pKa = 3.74CLLDD44 pKa = 4.71RR45 pKa = 11.84ITEE48 pKa = 4.09RR49 pKa = 11.84AEE51 pKa = 4.09DD52 pKa = 3.66SGNEE56 pKa = 4.05SEE58 pKa = 4.91GDD60 pKa = 3.42RR61 pKa = 11.84EE62 pKa = 4.18KK63 pKa = 11.08LSKK66 pKa = 10.24LVEE69 pKa = 4.43MGHH72 pKa = 6.07HH73 pKa = 6.53APWDD77 pKa = 3.51IDD79 pKa = 3.74DD80 pKa = 4.17LL81 pKa = 5.12
MM1 pKa = 7.14QPLGIIAIAALVVAIILAIVVWTIVFIEE29 pKa = 3.8YY30 pKa = 10.32RR31 pKa = 11.84RR32 pKa = 11.84IKK34 pKa = 8.69KK35 pKa = 8.34QRR37 pKa = 11.84RR38 pKa = 11.84IDD40 pKa = 3.74CLLDD44 pKa = 4.71RR45 pKa = 11.84ITEE48 pKa = 4.09RR49 pKa = 11.84AEE51 pKa = 4.09DD52 pKa = 3.66SGNEE56 pKa = 4.05SEE58 pKa = 4.91GDD60 pKa = 3.42RR61 pKa = 11.84EE62 pKa = 4.18KK63 pKa = 11.08LSKK66 pKa = 10.24LVEE69 pKa = 4.43MGHH72 pKa = 6.07HH73 pKa = 6.53APWDD77 pKa = 3.51IDD79 pKa = 3.74DD80 pKa = 4.17LL81 pKa = 5.12
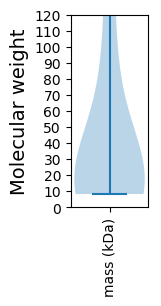
Molecular weight: 9.27 kDa
Isoelectric point according different methods:
Protein with the highest isoelectric point:
>sp|P04604|NEF_HV1EL Protein Nef OS=Human immunodeficiency virus type 1 group M subtype D (isolate ELI) OX=11689 GN=nef PE=3 SV=3
MM1 pKa = 7.3EE2 pKa = 5.21NRR4 pKa = 11.84WQVMIVWQVDD14 pKa = 3.01RR15 pKa = 11.84MRR17 pKa = 11.84IKK19 pKa = 8.93TWKK22 pKa = 10.27SLVKK26 pKa = 9.92HH27 pKa = 5.93HH28 pKa = 6.62MYY30 pKa = 10.3VSKK33 pKa = 10.69KK34 pKa = 9.11ANRR37 pKa = 11.84WFYY40 pKa = 8.75RR41 pKa = 11.84HH42 pKa = 6.55HH43 pKa = 6.98YY44 pKa = 8.54EE45 pKa = 4.5SPHH48 pKa = 5.99PKK50 pKa = 9.39ISSEE54 pKa = 3.83VHH56 pKa = 5.47IPLGEE61 pKa = 3.87ARR63 pKa = 11.84LVIKK67 pKa = 7.97TYY69 pKa = 9.61WGLHH73 pKa = 4.19TGEE76 pKa = 4.9RR77 pKa = 11.84EE78 pKa = 3.63WHH80 pKa = 6.26LGQGVSIEE88 pKa = 3.9WRR90 pKa = 11.84KK91 pKa = 9.69RR92 pKa = 11.84RR93 pKa = 11.84YY94 pKa = 8.15STQVDD99 pKa = 3.64PGLADD104 pKa = 3.49QLIHH108 pKa = 6.69MYY110 pKa = 10.84YY111 pKa = 10.01FDD113 pKa = 5.16CFSEE117 pKa = 4.31SAIRR121 pKa = 11.84KK122 pKa = 9.37AILGDD127 pKa = 3.44IVSPRR132 pKa = 11.84CEE134 pKa = 3.92YY135 pKa = 10.43QAGHH139 pKa = 6.19NKK141 pKa = 9.66VGSLQYY147 pKa = 10.82LALTALIAPKK157 pKa = 9.93QIKK160 pKa = 9.61PPLPSVRR167 pKa = 11.84KK168 pKa = 8.46LTEE171 pKa = 4.09DD172 pKa = 2.93RR173 pKa = 11.84WNKK176 pKa = 8.03PQQTRR181 pKa = 11.84GHH183 pKa = 6.48RR184 pKa = 11.84GSHH187 pKa = 4.85TMNGHH192 pKa = 6.05
MM1 pKa = 7.3EE2 pKa = 5.21NRR4 pKa = 11.84WQVMIVWQVDD14 pKa = 3.01RR15 pKa = 11.84MRR17 pKa = 11.84IKK19 pKa = 8.93TWKK22 pKa = 10.27SLVKK26 pKa = 9.92HH27 pKa = 5.93HH28 pKa = 6.62MYY30 pKa = 10.3VSKK33 pKa = 10.69KK34 pKa = 9.11ANRR37 pKa = 11.84WFYY40 pKa = 8.75RR41 pKa = 11.84HH42 pKa = 6.55HH43 pKa = 6.98YY44 pKa = 8.54EE45 pKa = 4.5SPHH48 pKa = 5.99PKK50 pKa = 9.39ISSEE54 pKa = 3.83VHH56 pKa = 5.47IPLGEE61 pKa = 3.87ARR63 pKa = 11.84LVIKK67 pKa = 7.97TYY69 pKa = 9.61WGLHH73 pKa = 4.19TGEE76 pKa = 4.9RR77 pKa = 11.84EE78 pKa = 3.63WHH80 pKa = 6.26LGQGVSIEE88 pKa = 3.9WRR90 pKa = 11.84KK91 pKa = 9.69RR92 pKa = 11.84RR93 pKa = 11.84YY94 pKa = 8.15STQVDD99 pKa = 3.64PGLADD104 pKa = 3.49QLIHH108 pKa = 6.69MYY110 pKa = 10.84YY111 pKa = 10.01FDD113 pKa = 5.16CFSEE117 pKa = 4.31SAIRR121 pKa = 11.84KK122 pKa = 9.37AILGDD127 pKa = 3.44IVSPRR132 pKa = 11.84CEE134 pKa = 3.92YY135 pKa = 10.43QAGHH139 pKa = 6.19NKK141 pKa = 9.66VGSLQYY147 pKa = 10.82LALTALIAPKK157 pKa = 9.93QIKK160 pKa = 9.61PPLPSVRR167 pKa = 11.84KK168 pKa = 8.46LTEE171 pKa = 4.09DD172 pKa = 2.93RR173 pKa = 11.84WNKK176 pKa = 8.03PQQTRR181 pKa = 11.84GHH183 pKa = 6.48RR184 pKa = 11.84GSHH187 pKa = 4.85TMNGHH192 pKa = 6.05
Molecular weight: 22.69 kDa
Isoelectric point according different methods:
Peptides (in silico digests for buttom-up proteomics)
Below you can find in silico digests of the whole proteome with Trypsin, Chymotrypsin, Trypsin+LysC, LysN, ArgC proteases suitable for different mass spec machines.| Try ESI |
 |
|---|
| ChTry ESI |
|
|---|
| ArgC ESI |
|
|---|
| LysN ESI |
|
|---|
| TryLysC ESI |
|
|---|
| Try MALDI |
|
|---|
| ChTry MALDI |
|
|---|
| ArgC MALDI |
|
|---|
| LysN MALDI |
|
|---|
| TryLysC MALDI |
|
|---|
| Try LTQ |
|
|---|
| ChTry LTQ |
|
|---|
| ArgC LTQ |
|
|---|
| LysN LTQ |
|
|---|
| TryLysC LTQ |
|
|---|
| Try MSlow |
|
|---|
| ChTry MSlow |
|
|---|
| ArgC MSlow |
|
|---|
| LysN MSlow |
|
|---|
| TryLysC MSlow |
|
|---|
| Try MShigh |
|
|---|
| ChTry MShigh |
|
|---|
| ArgC MShigh |
|
|---|
| LysN MShigh |
|
|---|
| TryLysC MShigh |
|
|---|
General Statistics
Number of major isoforms |
Number of additional isoforms |
Number of all proteins |
Number of amino acids |
Min. Seq. Length |
Max. Seq. Length |
Avg. Seq. Length |
Avg. Mol. Weight |
|---|---|---|---|---|---|---|---|
3652 |
72 |
1435 |
365.2 |
41.41 |
Amino acid frequency
Ala |
Cys |
Asp |
Glu |
Phe |
Gly |
His |
Ile |
Lys |
Leu |
|---|---|---|---|---|---|---|---|---|---|
6.38 ± 0.467 | 2.136 ± 0.455 |
3.779 ± 0.351 | 7.065 ± 0.473 |
2.3 ± 0.155 | 7.229 ± 0.261 |
2.245 ± 0.519 | 6.955 ± 0.632 |
6.982 ± 0.983 | 8.215 ± 0.564 |
Met |
Asn |
Gln |
Pro |
Arg |
Ser |
Thr |
Val |
Trp |
Tyr |
|---|---|---|---|---|---|---|---|---|---|
2.136 ± 0.211 | 4.737 ± 0.699 |
5.75 ± 0.913 | 5.969 ± 0.397 |
6.38 ± 0.843 | 5.367 ± 0.562 |
5.531 ± 0.504 | 5.559 ± 0.429 |
2.683 ± 0.287 | 2.601 ± 0.201 |
Most of the basic statistics you can see at this page can be downloaded from this CSV file
See this proteome in:

Proteome-pI is available under Creative Commons Attribution-NoDerivs license, for more details see here
| Reference: Kozlowski LP. Proteome-pI 2.0: Proteome Isoelectric Point Database Update. Nucleic Acids Res. 2021, doi: 10.1093/nar/gkab944 | Contact: Lukasz P. Kozlowski |