Mycobacterium phage Patience
Taxonomy: Viruses; Duplodnaviria; Heunggongvirae; Uroviricota; Caudoviricetes; Caudovirales; Siphoviridae; Patiencevirus; Mycobacterium virus Patience
Average proteome isoelectric point is 6.22
Get precalculated fractions of proteins
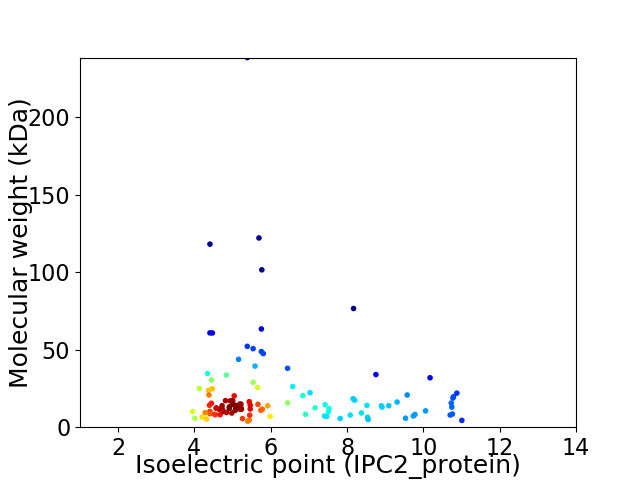
Virtual 2D-PAGE plot for 110 proteins (isoelectric point calculated using IPC2_protein)
Get csv file with sequences according to given criteria:
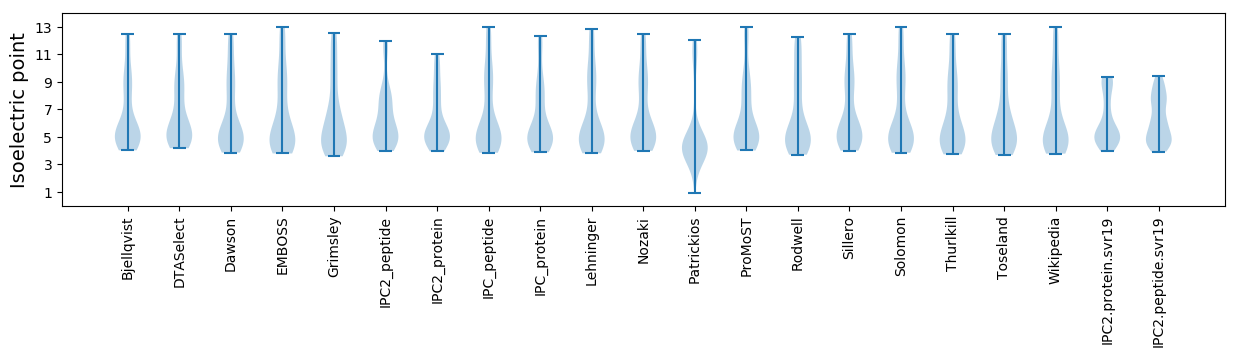
* You can choose from 21 different methods for calculating isoelectric point
Summary statistics related to proteome-wise predictions
Protein with the lowest isoelectric point:
>tr|G1JWH6|G1JWH6_9CAUD Uncharacterized protein OS=Mycobacterium phage Patience OX=1074308 GN=65 PE=4 SV=1
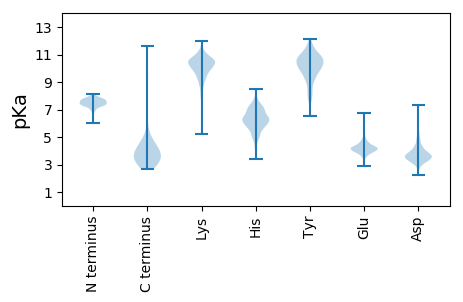
MM1 pKa = 7.42KK2 pKa = 9.95PIFEE6 pKa = 4.94IIGLIAMAAWLAFCVYY22 pKa = 9.33WGVVLEE28 pKa = 4.39RR29 pKa = 11.84NYY31 pKa = 10.55PVNQKK36 pKa = 9.86EE37 pKa = 4.55DD38 pKa = 3.56NDD40 pKa = 3.84NDD42 pKa = 3.71SEE44 pKa = 4.54YY45 pKa = 11.64
MM1 pKa = 7.42KK2 pKa = 9.95PIFEE6 pKa = 4.94IIGLIAMAAWLAFCVYY22 pKa = 9.33WGVVLEE28 pKa = 4.39RR29 pKa = 11.84NYY31 pKa = 10.55PVNQKK36 pKa = 9.86EE37 pKa = 4.55DD38 pKa = 3.56NDD40 pKa = 3.84NDD42 pKa = 3.71SEE44 pKa = 4.54YY45 pKa = 11.64
Molecular weight: 5.27 kDa
Isoelectric point according different methods:
Protein with the highest isoelectric point:
>tr|G1JWB2|G1JWB2_9CAUD Uncharacterized protein OS=Mycobacterium phage Patience OX=1074308 GN=1 PE=4 SV=1
MM1 pKa = 7.32ARR3 pKa = 11.84IGRR6 pKa = 11.84RR7 pKa = 11.84KK8 pKa = 9.12RR9 pKa = 11.84RR10 pKa = 11.84RR11 pKa = 11.84FSVMTKK17 pKa = 10.32FVSTKK22 pKa = 9.93YY23 pKa = 9.63GSKK26 pKa = 10.27VKK28 pKa = 10.6LVIPGLRR35 pKa = 11.84KK36 pKa = 9.51RR37 pKa = 4.05
MM1 pKa = 7.32ARR3 pKa = 11.84IGRR6 pKa = 11.84RR7 pKa = 11.84KK8 pKa = 9.12RR9 pKa = 11.84RR10 pKa = 11.84RR11 pKa = 11.84FSVMTKK17 pKa = 10.32FVSTKK22 pKa = 9.93YY23 pKa = 9.63GSKK26 pKa = 10.27VKK28 pKa = 10.6LVIPGLRR35 pKa = 11.84KK36 pKa = 9.51RR37 pKa = 4.05
Molecular weight: 4.41 kDa
Isoelectric point according different methods:
Peptides (in silico digests for buttom-up proteomics)
Below you can find in silico digests of the whole proteome with Trypsin, Chymotrypsin, Trypsin+LysC, LysN, ArgC proteases suitable for different mass spec machines.| Try ESI |
 |
|---|
| ChTry ESI |
|
|---|
| ArgC ESI |
|
|---|
| LysN ESI |
|
|---|
| TryLysC ESI |
|
|---|
| Try MALDI |
|
|---|
| ChTry MALDI |
|
|---|
| ArgC MALDI |
|
|---|
| LysN MALDI |
|
|---|
| TryLysC MALDI |
|
|---|
| Try LTQ |
|
|---|
| ChTry LTQ |
|
|---|
| ArgC LTQ |
|
|---|
| LysN LTQ |
|
|---|
| TryLysC LTQ |
|
|---|
| Try MSlow |
|
|---|
| ChTry MSlow |
|
|---|
| ArgC MSlow |
|
|---|
| LysN MSlow |
|
|---|
| TryLysC MSlow |
|
|---|
| Try MShigh |
|
|---|
| ChTry MShigh |
|
|---|
| ArgC MShigh |
|
|---|
| LysN MShigh |
|
|---|
| TryLysC MShigh |
|
|---|
General Statistics
Number of major isoforms |
Number of additional isoforms |
Number of all proteins |
Number of amino acids |
Min. Seq. Length |
Max. Seq. Length |
Avg. Seq. Length |
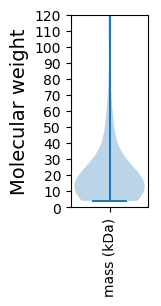
Avg. Mol. Weight |
|---|---|---|---|---|---|---|---|
0 |
22294 |
31 |
2215 |
202.7 |
22.6 |
Amino acid frequency
Ala |
Cys |
Asp |
Glu |
Phe |
Gly |
His |
Ile |
Lys |
Leu |
|---|---|---|---|---|---|---|---|---|---|
8.751 ± 0.417 | 0.875 ± 0.14 |
6.374 ± 0.196 | 6.908 ± 0.295 |
3.701 ± 0.175 | 7.984 ± 0.318 |
1.853 ± 0.154 | 5.822 ± 0.195 |
6.055 ± 0.424 | 7.208 ± 0.259 |
Met |
Asn |
Gln |
Pro |
Arg |
Ser |
Thr |
Val |
Trp |
Tyr |
|---|---|---|---|---|---|---|---|---|---|
2.368 ± 0.121 | 4.571 ± 0.199 |
4.813 ± 0.175 | 3.647 ± 0.215 |
6.311 ± 0.33 | 5.759 ± 0.176 |
5.764 ± 0.202 | 6.486 ± 0.233 |
1.835 ± 0.132 | 2.916 ± 0.184 |
Most of the basic statistics you can see at this page can be downloaded from this CSV file
See this proteome in:

Proteome-pI is available under Creative Commons Attribution-NoDerivs license, for more details see here
| Reference: Kozlowski LP. Proteome-pI 2.0: Proteome Isoelectric Point Database Update. Nucleic Acids Res. 2021, doi: 10.1093/nar/gkab944 | Contact: Lukasz P. Kozlowski |