Human immunodeficiency virus type 1 group M subtype C (isolate ETH2220) (HIV-1)
Taxonomy: Viruses; Riboviria; Pararnavirae; Artverviricota; Revtraviricetes; Ortervirales; Retroviridae; Orthoretrovirinae; Lentivirus; Human immunodeficiency virus 1; HIV-1 group M; HIV-1 M:C
Average proteome isoelectric point is 7.35
Get precalculated fractions of proteins
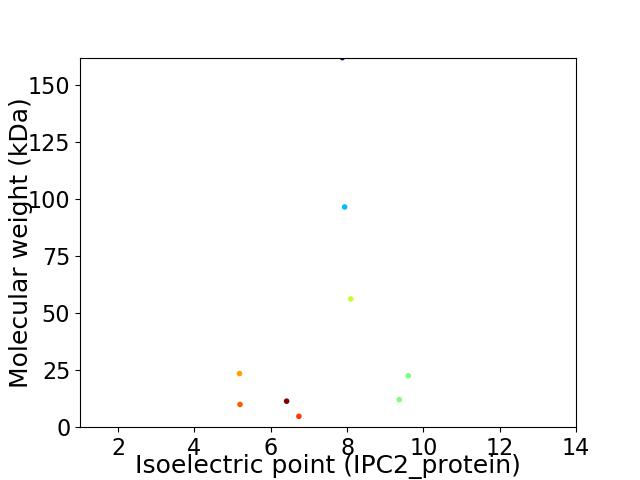
Virtual 2D-PAGE plot for 9 proteins (isoelectric point calculated using IPC2_protein)
Get csv file with sequences according to given criteria:
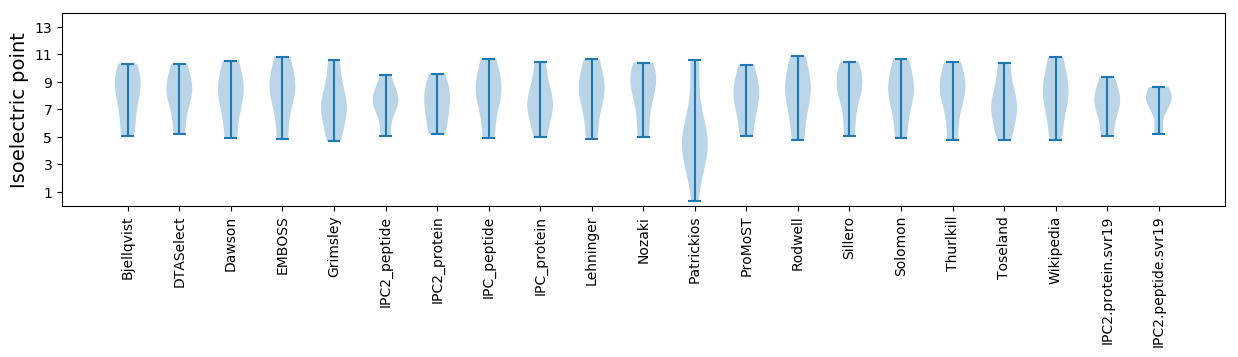
* You can choose from 21 different methods for calculating isoelectric point
Summary statistics related to proteome-wise predictions
Protein with the lowest isoelectric point:
>sp|Q75009|NEF_HV1ET Protein Nef OS=Human immunodeficiency virus type 1 group M subtype C (isolate ETH2220) OX=388796 GN=nef PE=3 SV=3
MM1 pKa = 7.62GGTMSKK7 pKa = 9.86CSPVGWPAIRR17 pKa = 11.84EE18 pKa = 4.26RR19 pKa = 11.84IRR21 pKa = 11.84RR22 pKa = 11.84AAPAAEE28 pKa = 4.14GVGAASRR35 pKa = 11.84DD36 pKa = 3.4LDD38 pKa = 3.67KK39 pKa = 11.74YY40 pKa = 11.05GALTSSNTPANNPDD54 pKa = 4.12CAWLEE59 pKa = 3.91AQEE62 pKa = 4.4EE63 pKa = 4.48EE64 pKa = 4.71EE65 pKa = 4.28EE66 pKa = 4.33VGFPVRR72 pKa = 11.84PQVPLRR78 pKa = 11.84PMTYY82 pKa = 9.93KK83 pKa = 10.8AAFDD87 pKa = 3.84LSLFLKK93 pKa = 10.48EE94 pKa = 4.21KK95 pKa = 10.76GGLEE99 pKa = 3.66GLIYY103 pKa = 10.31SKK105 pKa = 10.57KK106 pKa = 9.41RR107 pKa = 11.84QEE109 pKa = 5.1ILDD112 pKa = 3.47LWVYY116 pKa = 7.69NTQGFFPDD124 pKa = 3.4WQNYY128 pKa = 5.91TPGPGVRR135 pKa = 11.84YY136 pKa = 8.59PLTFGWCFKK145 pKa = 10.33LVPVDD150 pKa = 3.57PSEE153 pKa = 4.13VEE155 pKa = 4.22EE156 pKa = 4.3INEE159 pKa = 4.26GEE161 pKa = 4.35NNCLLHH167 pKa = 6.33PASLHH172 pKa = 5.46GMEE175 pKa = 5.41DD176 pKa = 3.29EE177 pKa = 4.82DD178 pKa = 6.22RR179 pKa = 11.84EE180 pKa = 4.27VLKK183 pKa = 10.68WKK185 pKa = 10.26FDD187 pKa = 3.23SHH189 pKa = 6.4LARR192 pKa = 11.84RR193 pKa = 11.84HH194 pKa = 4.64MARR197 pKa = 11.84EE198 pKa = 3.9LHH200 pKa = 6.01PEE202 pKa = 4.04YY203 pKa = 11.23YY204 pKa = 10.12KK205 pKa = 11.05DD206 pKa = 3.59CC207 pKa = 4.69
MM1 pKa = 7.62GGTMSKK7 pKa = 9.86CSPVGWPAIRR17 pKa = 11.84EE18 pKa = 4.26RR19 pKa = 11.84IRR21 pKa = 11.84RR22 pKa = 11.84AAPAAEE28 pKa = 4.14GVGAASRR35 pKa = 11.84DD36 pKa = 3.4LDD38 pKa = 3.67KK39 pKa = 11.74YY40 pKa = 11.05GALTSSNTPANNPDD54 pKa = 4.12CAWLEE59 pKa = 3.91AQEE62 pKa = 4.4EE63 pKa = 4.48EE64 pKa = 4.71EE65 pKa = 4.28EE66 pKa = 4.33VGFPVRR72 pKa = 11.84PQVPLRR78 pKa = 11.84PMTYY82 pKa = 9.93KK83 pKa = 10.8AAFDD87 pKa = 3.84LSLFLKK93 pKa = 10.48EE94 pKa = 4.21KK95 pKa = 10.76GGLEE99 pKa = 3.66GLIYY103 pKa = 10.31SKK105 pKa = 10.57KK106 pKa = 9.41RR107 pKa = 11.84QEE109 pKa = 5.1ILDD112 pKa = 3.47LWVYY116 pKa = 7.69NTQGFFPDD124 pKa = 3.4WQNYY128 pKa = 5.91TPGPGVRR135 pKa = 11.84YY136 pKa = 8.59PLTFGWCFKK145 pKa = 10.33LVPVDD150 pKa = 3.57PSEE153 pKa = 4.13VEE155 pKa = 4.22EE156 pKa = 4.3INEE159 pKa = 4.26GEE161 pKa = 4.35NNCLLHH167 pKa = 6.33PASLHH172 pKa = 5.46GMEE175 pKa = 5.41DD176 pKa = 3.29EE177 pKa = 4.82DD178 pKa = 6.22RR179 pKa = 11.84EE180 pKa = 4.27VLKK183 pKa = 10.68WKK185 pKa = 10.26FDD187 pKa = 3.23SHH189 pKa = 6.4LARR192 pKa = 11.84RR193 pKa = 11.84HH194 pKa = 4.64MARR197 pKa = 11.84EE198 pKa = 3.9LHH200 pKa = 6.01PEE202 pKa = 4.04YY203 pKa = 11.23YY204 pKa = 10.12KK205 pKa = 11.05DD206 pKa = 3.59CC207 pKa = 4.69
Molecular weight: 23.53 kDa
Isoelectric point according different methods:
Protein with the highest isoelectric point:
>sp|Q75007|VPU_HV1ET Protein Vpu OS=Human immunodeficiency virus type 1 group M subtype C (isolate ETH2220) OX=388796 GN=vpu PE=3 SV=1
MM1 pKa = 7.87AGRR4 pKa = 11.84SGDD7 pKa = 3.63SDD9 pKa = 4.15EE10 pKa = 4.95EE11 pKa = 3.93LLKK14 pKa = 10.7AVRR17 pKa = 11.84IIKK20 pKa = 9.77ILYY23 pKa = 8.82QSNPYY28 pKa = 7.2PTPEE32 pKa = 3.82GTRR35 pKa = 11.84QARR38 pKa = 11.84RR39 pKa = 11.84NRR41 pKa = 11.84RR42 pKa = 11.84RR43 pKa = 11.84RR44 pKa = 11.84WRR46 pKa = 11.84ARR48 pKa = 11.84QRR50 pKa = 11.84QIHH53 pKa = 5.3TLSEE57 pKa = 4.7RR58 pKa = 11.84ILSNFLGRR66 pKa = 11.84PAEE69 pKa = 4.09PVPLQLPPLEE79 pKa = 4.91RR80 pKa = 11.84LNLDD84 pKa = 3.43CSEE87 pKa = 4.98DD88 pKa = 3.62SGTSGTQQSQGTTEE102 pKa = 4.47GVGNPP107 pKa = 3.79
MM1 pKa = 7.87AGRR4 pKa = 11.84SGDD7 pKa = 3.63SDD9 pKa = 4.15EE10 pKa = 4.95EE11 pKa = 3.93LLKK14 pKa = 10.7AVRR17 pKa = 11.84IIKK20 pKa = 9.77ILYY23 pKa = 8.82QSNPYY28 pKa = 7.2PTPEE32 pKa = 3.82GTRR35 pKa = 11.84QARR38 pKa = 11.84RR39 pKa = 11.84NRR41 pKa = 11.84RR42 pKa = 11.84RR43 pKa = 11.84RR44 pKa = 11.84WRR46 pKa = 11.84ARR48 pKa = 11.84QRR50 pKa = 11.84QIHH53 pKa = 5.3TLSEE57 pKa = 4.7RR58 pKa = 11.84ILSNFLGRR66 pKa = 11.84PAEE69 pKa = 4.09PVPLQLPPLEE79 pKa = 4.91RR80 pKa = 11.84LNLDD84 pKa = 3.43CSEE87 pKa = 4.98DD88 pKa = 3.62SGTSGTQQSQGTTEE102 pKa = 4.47GVGNPP107 pKa = 3.79
Molecular weight: 12.08 kDa
Isoelectric point according different methods:
Peptides (in silico digests for buttom-up proteomics)
Below you can find in silico digests of the whole proteome with Trypsin, Chymotrypsin, Trypsin+LysC, LysN, ArgC proteases suitable for different mass spec machines.| Try ESI |
 |
|---|
| ChTry ESI |
|
|---|
| ArgC ESI |
|
|---|
| LysN ESI |
|
|---|
| TryLysC ESI |
|
|---|
| Try MALDI |
|
|---|
| ChTry MALDI |
|
|---|
| ArgC MALDI |
|
|---|
| LysN MALDI |
|
|---|
| TryLysC MALDI |
|
|---|
| Try LTQ |
|
|---|
| ChTry LTQ |
|
|---|
| ArgC LTQ |
|
|---|
| LysN LTQ |
|
|---|
| TryLysC LTQ |
|
|---|
| Try MSlow |
|
|---|
| ChTry MSlow |
|
|---|
| ArgC MSlow |
|
|---|
| LysN MSlow |
|
|---|
| TryLysC MSlow |
|
|---|
| Try MShigh |
|
|---|
| ChTry MShigh |
|
|---|
| ArgC MShigh |
|
|---|
| LysN MShigh |
|
|---|
| TryLysC MShigh |
|
|---|
General Statistics
Number of major isoforms |
Number of additional isoforms |
Number of all proteins |
Number of amino acids |
Min. Seq. Length |
Max. Seq. Length |
Avg. Seq. Length |
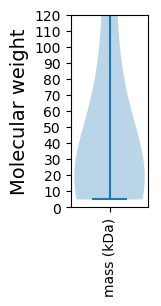
Avg. Mol. Weight |
|---|---|---|---|---|---|---|---|
0 |
3524 |
42 |
1439 |
391.6 |
44.38 |
Amino acid frequency
Ala |
Cys |
Asp |
Glu |
Phe |
Gly |
His |
Ile |
Lys |
Leu |
|---|---|---|---|---|---|---|---|---|---|
6.64 ± 0.556 | 1.958 ± 0.371 |
4.37 ± 0.254 | 6.867 ± 0.591 |
2.866 ± 0.278 | 7.123 ± 0.195 |
2.185 ± 0.723 | 6.782 ± 0.957 |
6.952 ± 0.894 | 8.74 ± 0.656 |
Met |
Asn |
Gln |
Pro |
Arg |
Ser |
Thr |
Val |
Trp |
Tyr |
|---|---|---|---|---|---|---|---|---|---|
2.327 ± 0.261 | 4.966 ± 0.608 |
5.533 ± 0.687 | 5.817 ± 0.653 |
5.817 ± 0.942 | 4.739 ± 0.446 |
5.704 ± 0.514 | 5.533 ± 0.425 |
2.639 ± 0.276 | 2.44 ± 0.368 |
Most of the basic statistics you can see at this page can be downloaded from this CSV file
See this proteome in:

Proteome-pI is available under Creative Commons Attribution-NoDerivs license, for more details see here
| Reference: Kozlowski LP. Proteome-pI 2.0: Proteome Isoelectric Point Database Update. Nucleic Acids Res. 2021, doi: 10.1093/nar/gkab944 | Contact: Lukasz P. Kozlowski |