Romboutsia hominis
Taxonomy: cellular organisms; Bacteria; Terrabacteria group; Firmicutes; Clostridia; Eubacteriales; Peptostreptococcaceae; Romboutsia
Average proteome isoelectric point is 6.5
Get precalculated fractions of proteins
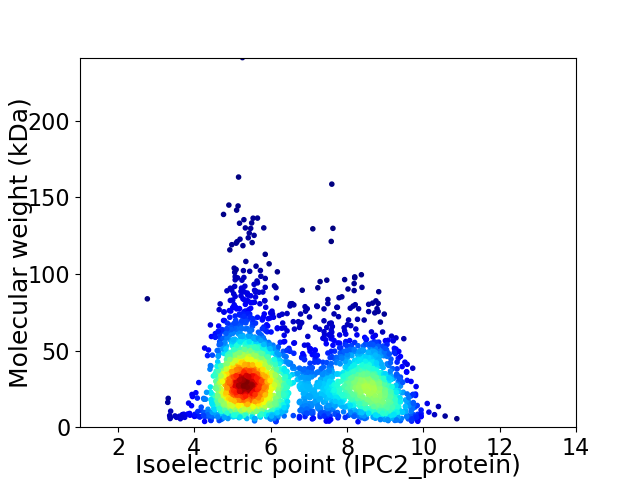
Virtual 2D-PAGE plot for 2851 proteins (isoelectric point calculated using IPC2_protein)
Get csv file with sequences according to given criteria:
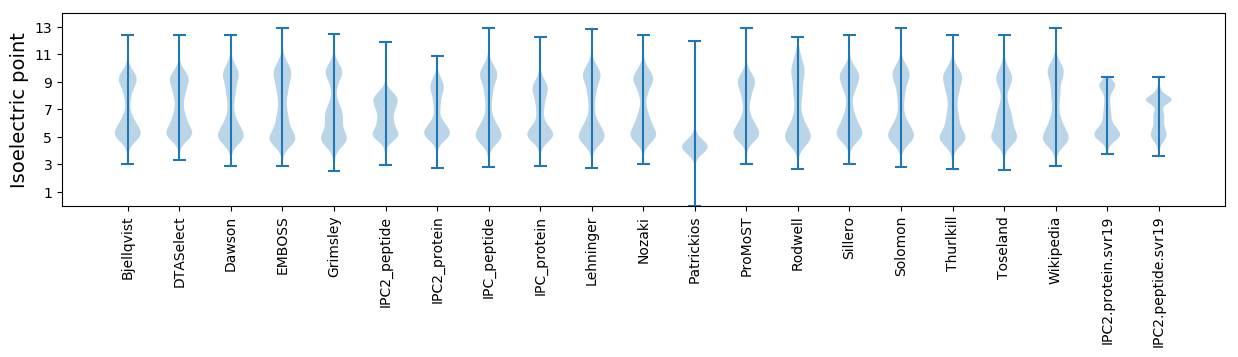
* You can choose from 21 different methods for calculating isoelectric point
Summary statistics related to proteome-wise predictions
Protein with the lowest isoelectric point:
>tr|A0A2P2BNR7|A0A2P2BNR7_9FIRM DNA polymerase I OS=Romboutsia hominis OX=1507512 GN=polA PE=3 SV=1
MM1 pKa = 7.28EE2 pKa = 4.59QLKK5 pKa = 11.14DD6 pKa = 3.36MLRR9 pKa = 11.84GFDD12 pKa = 4.23FVDD15 pKa = 4.2DD16 pKa = 3.85NPMIFFLIIGLVVLLLINSNGNLDD40 pKa = 4.77CFFDD44 pKa = 4.03QNNSLVWIILLVFLVFMLGRR64 pKa = 11.84NDD66 pKa = 3.45GCHH69 pKa = 7.56DD70 pKa = 4.44DD71 pKa = 4.23FCCC74 pKa = 5.33
MM1 pKa = 7.28EE2 pKa = 4.59QLKK5 pKa = 11.14DD6 pKa = 3.36MLRR9 pKa = 11.84GFDD12 pKa = 4.23FVDD15 pKa = 4.2DD16 pKa = 3.85NPMIFFLIIGLVVLLLINSNGNLDD40 pKa = 4.77CFFDD44 pKa = 4.03QNNSLVWIILLVFLVFMLGRR64 pKa = 11.84NDD66 pKa = 3.45GCHH69 pKa = 7.56DD70 pKa = 4.44DD71 pKa = 4.23FCCC74 pKa = 5.33
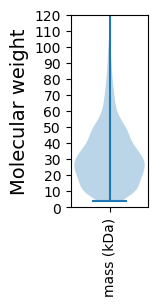
Molecular weight: 8.57 kDa
Isoelectric point according different methods:
Protein with the highest isoelectric point:
>tr|A0A2P2BVF4|A0A2P2BVF4_9FIRM Glutamate--tRNA ligase OS=Romboutsia hominis OX=1507512 GN=gltX PE=3 SV=1
MM1 pKa = 7.36KK2 pKa = 9.43RR3 pKa = 11.84TYY5 pKa = 9.67QPKK8 pKa = 9.0KK9 pKa = 7.87RR10 pKa = 11.84QRR12 pKa = 11.84KK13 pKa = 8.39KK14 pKa = 8.49EE15 pKa = 3.5HH16 pKa = 6.11GFRR19 pKa = 11.84KK20 pKa = 9.77RR21 pKa = 11.84MKK23 pKa = 9.11TSNGRR28 pKa = 11.84NVLKK32 pKa = 10.51RR33 pKa = 11.84RR34 pKa = 11.84RR35 pKa = 11.84AKK37 pKa = 9.37GRR39 pKa = 11.84KK40 pKa = 8.95RR41 pKa = 11.84LTHH44 pKa = 6.22
MM1 pKa = 7.36KK2 pKa = 9.43RR3 pKa = 11.84TYY5 pKa = 9.67QPKK8 pKa = 9.0KK9 pKa = 7.87RR10 pKa = 11.84QRR12 pKa = 11.84KK13 pKa = 8.39KK14 pKa = 8.49EE15 pKa = 3.5HH16 pKa = 6.11GFRR19 pKa = 11.84KK20 pKa = 9.77RR21 pKa = 11.84MKK23 pKa = 9.11TSNGRR28 pKa = 11.84NVLKK32 pKa = 10.51RR33 pKa = 11.84RR34 pKa = 11.84RR35 pKa = 11.84AKK37 pKa = 9.37GRR39 pKa = 11.84KK40 pKa = 8.95RR41 pKa = 11.84LTHH44 pKa = 6.22
Molecular weight: 5.53 kDa
Isoelectric point according different methods:
Peptides (in silico digests for buttom-up proteomics)
Below you can find in silico digests of the whole proteome with Trypsin, Chymotrypsin, Trypsin+LysC, LysN, ArgC proteases suitable for different mass spec machines.| Try ESI |
 |
|---|
| ChTry ESI |
|
|---|
| ArgC ESI |
|
|---|
| LysN ESI |
|
|---|
| TryLysC ESI |
|
|---|
| Try MALDI |
|
|---|
| ChTry MALDI |
|
|---|
| ArgC MALDI |
|
|---|
| LysN MALDI |
|
|---|
| TryLysC MALDI |
|
|---|
| Try LTQ |
|
|---|
| ChTry LTQ |
|
|---|
| ArgC LTQ |
|
|---|
| LysN LTQ |
|
|---|
| TryLysC LTQ |
|
|---|
| Try MSlow |
|
|---|
| ChTry MSlow |
|
|---|
| ArgC MSlow |
|
|---|
| LysN MSlow |
|
|---|
| TryLysC MSlow |
|
|---|
| Try MShigh |
|
|---|
| ChTry MShigh |
|
|---|
| ArgC MShigh |
|
|---|
| LysN MShigh |
|
|---|
| TryLysC MShigh |
|
|---|
General Statistics
Number of major isoforms |
Number of additional isoforms |
Number of all proteins |
Number of amino acids |
Min. Seq. Length |
Max. Seq. Length |
Avg. Seq. Length |
Avg. Mol. Weight |
|---|---|---|---|---|---|---|---|
0 |
844586 |
30 |
2131 |
296.2 |
33.44 |
Amino acid frequency
Ala |
Cys |
Asp |
Glu |
Phe |
Gly |
His |
Ile |
Lys |
Leu |
|---|---|---|---|---|---|---|---|---|---|
5.309 ± 0.057 | 1.178 ± 0.02 |
5.769 ± 0.048 | 7.37 ± 0.058 |
4.162 ± 0.039 | 6.3 ± 0.051 |
1.362 ± 0.02 | 10.465 ± 0.074 |
9.337 ± 0.047 | 8.998 ± 0.05 |
Met |
Asn |
Gln |
Pro |
Arg |
Ser |
Thr |
Val |
Trp |
Tyr |
|---|---|---|---|---|---|---|---|---|---|
2.682 ± 0.021 | 6.624 ± 0.047 |
2.679 ± 0.027 | 2.189 ± 0.021 |
3.124 ± 0.031 | 6.374 ± 0.046 |
4.771 ± 0.032 | 6.57 ± 0.043 |
0.547 ± 0.012 | 4.19 ± 0.037 |
Most of the basic statistics you can see at this page can be downloaded from this CSV file
See this proteome in:

Proteome-pI is available under Creative Commons Attribution-NoDerivs license, for more details see here
| Reference: Kozlowski LP. Proteome-pI 2.0: Proteome Isoelectric Point Database Update. Nucleic Acids Res. 2021, doi: 10.1093/nar/gkab944 | Contact: Lukasz P. Kozlowski |