Influenza A virus (A/northern shoveler/California/JN1447/2007(H7N2))
Taxonomy: Viruses; Riboviria; Orthornavirae; Negarnaviricota; Polyploviricotina; Insthoviricetes; Articulavirales; Orthomyxoviridae; Alphainfluenzavirus; Influenza A virus; H7N2 subtype
Average proteome isoelectric point is 6.8
Get precalculated fractions of proteins
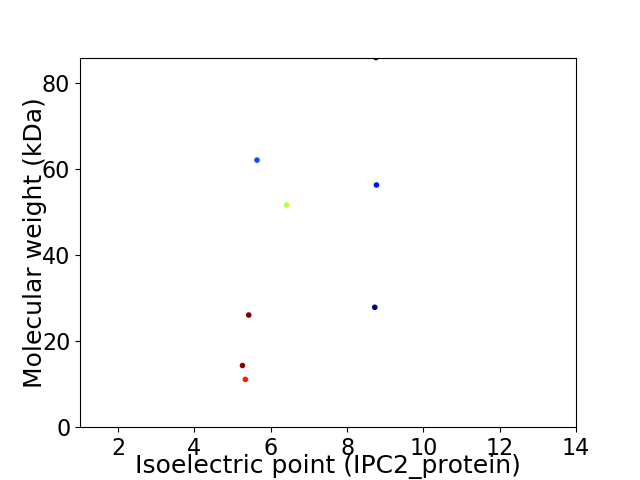
Virtual 2D-PAGE plot for 8 proteins (isoelectric point calculated using IPC2_protein)
Get csv file with sequences according to given criteria:
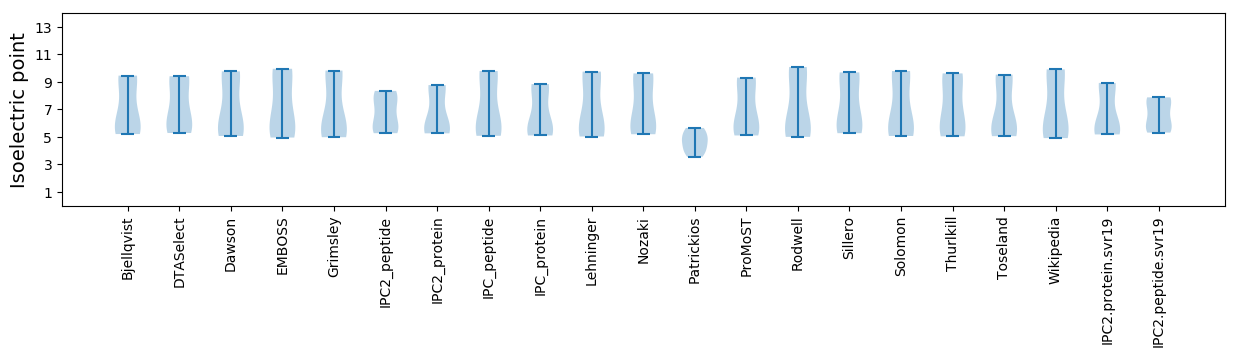
* You can choose from 21 different methods for calculating isoelectric point
Summary statistics related to proteome-wise predictions
Protein with the lowest isoelectric point:
>tr|E4UF17|E4UF17_9INFA Matrix protein 1 OS=Influenza A virus (A/northern shoveler/California/JN1447/2007(H7N2)) OX=686561 GN=M1 PE=3 SV=1
MM1 pKa = 7.58SLLTEE6 pKa = 4.21VATPTRR12 pKa = 11.84SGWEE16 pKa = 4.24CRR18 pKa = 11.84CSDD21 pKa = 3.53SSDD24 pKa = 4.08PIVIVASIIGILHH37 pKa = 7.1LILWILDD44 pKa = 3.39RR45 pKa = 11.84LFFKK49 pKa = 10.78CIYY52 pKa = 9.95RR53 pKa = 11.84RR54 pKa = 11.84LKK56 pKa = 10.55YY57 pKa = 10.03GLKK60 pKa = 10.09RR61 pKa = 11.84GPSTEE66 pKa = 4.68GIPEE70 pKa = 4.21SMRR73 pKa = 11.84EE74 pKa = 4.03EE75 pKa = 4.08YY76 pKa = 10.41RR77 pKa = 11.84QEE79 pKa = 3.7QQNAVGVDD87 pKa = 3.33DD88 pKa = 3.95GHH90 pKa = 6.3FVNIEE95 pKa = 3.83LEE97 pKa = 4.08
MM1 pKa = 7.58SLLTEE6 pKa = 4.21VATPTRR12 pKa = 11.84SGWEE16 pKa = 4.24CRR18 pKa = 11.84CSDD21 pKa = 3.53SSDD24 pKa = 4.08PIVIVASIIGILHH37 pKa = 7.1LILWILDD44 pKa = 3.39RR45 pKa = 11.84LFFKK49 pKa = 10.78CIYY52 pKa = 9.95RR53 pKa = 11.84RR54 pKa = 11.84LKK56 pKa = 10.55YY57 pKa = 10.03GLKK60 pKa = 10.09RR61 pKa = 11.84GPSTEE66 pKa = 4.68GIPEE70 pKa = 4.21SMRR73 pKa = 11.84EE74 pKa = 4.03EE75 pKa = 4.08YY76 pKa = 10.41RR77 pKa = 11.84QEE79 pKa = 3.7QQNAVGVDD87 pKa = 3.33DD88 pKa = 3.95GHH90 pKa = 6.3FVNIEE95 pKa = 3.83LEE97 pKa = 4.08
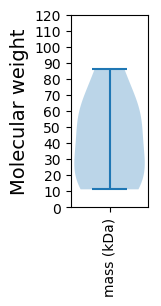
Molecular weight: 11.11 kDa
Isoelectric point according different methods:
Protein with the highest isoelectric point:
>tr|E4UF18|E4UF18_9INFA Neuraminidase OS=Influenza A virus (A/northern shoveler/California/JN1447/2007(H7N2)) OX=686561 GN=NA PE=3 SV=1
MM1 pKa = 7.58SLLTEE6 pKa = 3.91VATYY10 pKa = 10.42VLSIVPSGPLKK21 pKa = 11.07AEE23 pKa = 3.62IAQRR27 pKa = 11.84LEE29 pKa = 3.96DD30 pKa = 3.83VFAGKK35 pKa = 8.33NTDD38 pKa = 4.04LEE40 pKa = 5.12ALMEE44 pKa = 4.21WLKK47 pKa = 9.79TRR49 pKa = 11.84PILSPLTKK57 pKa = 10.4GILGFVFTLTVPSEE71 pKa = 4.2RR72 pKa = 11.84GLQRR76 pKa = 11.84RR77 pKa = 11.84RR78 pKa = 11.84FVQNALNGNGDD89 pKa = 4.31PNNMDD94 pKa = 3.72RR95 pKa = 11.84AVKK98 pKa = 10.36LYY100 pKa = 10.56RR101 pKa = 11.84KK102 pKa = 9.6LKK104 pKa = 10.61RR105 pKa = 11.84EE106 pKa = 3.99ITFHH110 pKa = 5.75GAKK113 pKa = 9.45EE114 pKa = 4.07VALSYY119 pKa = 10.16STGALASCMGLIYY132 pKa = 10.92NRR134 pKa = 11.84MGTVTTEE141 pKa = 3.79VAFGLVCATCEE152 pKa = 3.92QIADD156 pKa = 3.85SQHH159 pKa = 6.13RR160 pKa = 11.84SHH162 pKa = 6.73RR163 pKa = 11.84QMVTTTNPLIRR174 pKa = 11.84HH175 pKa = 5.69EE176 pKa = 4.07NRR178 pKa = 11.84MVLASTTAKK187 pKa = 10.69AMEE190 pKa = 4.27QIAGSSEE197 pKa = 3.83QAAEE201 pKa = 4.01AMEE204 pKa = 4.52VASQARR210 pKa = 11.84QMVQAMRR217 pKa = 11.84TIGTHH222 pKa = 6.14PSSSAGLKK230 pKa = 10.33DD231 pKa = 4.47DD232 pKa = 5.24LLEE235 pKa = 4.59NLQAYY240 pKa = 6.88QKK242 pKa = 10.84RR243 pKa = 11.84MGMQMQRR250 pKa = 11.84FKK252 pKa = 11.47
MM1 pKa = 7.58SLLTEE6 pKa = 3.91VATYY10 pKa = 10.42VLSIVPSGPLKK21 pKa = 11.07AEE23 pKa = 3.62IAQRR27 pKa = 11.84LEE29 pKa = 3.96DD30 pKa = 3.83VFAGKK35 pKa = 8.33NTDD38 pKa = 4.04LEE40 pKa = 5.12ALMEE44 pKa = 4.21WLKK47 pKa = 9.79TRR49 pKa = 11.84PILSPLTKK57 pKa = 10.4GILGFVFTLTVPSEE71 pKa = 4.2RR72 pKa = 11.84GLQRR76 pKa = 11.84RR77 pKa = 11.84RR78 pKa = 11.84FVQNALNGNGDD89 pKa = 4.31PNNMDD94 pKa = 3.72RR95 pKa = 11.84AVKK98 pKa = 10.36LYY100 pKa = 10.56RR101 pKa = 11.84KK102 pKa = 9.6LKK104 pKa = 10.61RR105 pKa = 11.84EE106 pKa = 3.99ITFHH110 pKa = 5.75GAKK113 pKa = 9.45EE114 pKa = 4.07VALSYY119 pKa = 10.16STGALASCMGLIYY132 pKa = 10.92NRR134 pKa = 11.84MGTVTTEE141 pKa = 3.79VAFGLVCATCEE152 pKa = 3.92QIADD156 pKa = 3.85SQHH159 pKa = 6.13RR160 pKa = 11.84SHH162 pKa = 6.73RR163 pKa = 11.84QMVTTTNPLIRR174 pKa = 11.84HH175 pKa = 5.69EE176 pKa = 4.07NRR178 pKa = 11.84MVLASTTAKK187 pKa = 10.69AMEE190 pKa = 4.27QIAGSSEE197 pKa = 3.83QAAEE201 pKa = 4.01AMEE204 pKa = 4.52VASQARR210 pKa = 11.84QMVQAMRR217 pKa = 11.84TIGTHH222 pKa = 6.14PSSSAGLKK230 pKa = 10.33DD231 pKa = 4.47DD232 pKa = 5.24LLEE235 pKa = 4.59NLQAYY240 pKa = 6.88QKK242 pKa = 10.84RR243 pKa = 11.84MGMQMQRR250 pKa = 11.84FKK252 pKa = 11.47
Molecular weight: 27.87 kDa
Isoelectric point according different methods:
Peptides (in silico digests for buttom-up proteomics)
Below you can find in silico digests of the whole proteome with Trypsin, Chymotrypsin, Trypsin+LysC, LysN, ArgC proteases suitable for different mass spec machines.| Try ESI |
 |
|---|
| ChTry ESI |
|
|---|
| ArgC ESI |
|
|---|
| LysN ESI |
|
|---|
| TryLysC ESI |
|
|---|
| Try MALDI |
|
|---|
| ChTry MALDI |
|
|---|
| ArgC MALDI |
|
|---|
| LysN MALDI |
|
|---|
| TryLysC MALDI |
|
|---|
| Try LTQ |
|
|---|
| ChTry LTQ |
|
|---|
| ArgC LTQ |
|
|---|
| LysN LTQ |
|
|---|
| TryLysC LTQ |
|
|---|
| Try MSlow |
|
|---|
| ChTry MSlow |
|
|---|
| ArgC MSlow |
|
|---|
| LysN MSlow |
|
|---|
| TryLysC MSlow |
|
|---|
| Try MShigh |
|
|---|
| ChTry MShigh |
|
|---|
| ArgC MShigh |
|
|---|
| LysN MShigh |
|
|---|
| TryLysC MShigh |
|
|---|
General Statistics
Number of major isoforms |
Number of additional isoforms |
Number of all proteins |
Number of amino acids |
Min. Seq. Length |
Max. Seq. Length |
Avg. Seq. Length |
Avg. Mol. Weight |
|---|---|---|---|---|---|---|---|
0 |
2986 |
97 |
759 |
373.3 |
41.91 |
Amino acid frequency
Ala |
Cys |
Asp |
Glu |
Phe |
Gly |
His |
Ile |
Lys |
Leu |
|---|---|---|---|---|---|---|---|---|---|
6.062 ± 0.658 | 1.942 ± 0.532 |
4.756 ± 0.334 | 6.631 ± 0.548 |
3.617 ± 0.283 | 7.569 ± 0.541 |
1.541 ± 0.118 | 6.865 ± 0.469 |
4.488 ± 0.416 | 7.77 ± 0.803 |
Met |
Asn |
Gln |
Pro |
Arg |
Ser |
Thr |
Val |
Trp |
Tyr |
|---|---|---|---|---|---|---|---|---|---|
3.751 ± 0.533 | 5.023 ± 0.509 |
3.617 ± 0.272 | 4.655 ± 0.388 |
7.535 ± 0.795 | 7.837 ± 0.548 |
6.631 ± 0.316 | 5.928 ± 0.714 |
1.541 ± 0.241 | 2.244 ± 0.201 |
Most of the basic statistics you can see at this page can be downloaded from this CSV file
See this proteome in:

Proteome-pI is available under Creative Commons Attribution-NoDerivs license, for more details see here
| Reference: Kozlowski LP. Proteome-pI 2.0: Proteome Isoelectric Point Database Update. Nucleic Acids Res. 2021, doi: 10.1093/nar/gkab944 | Contact: Lukasz P. Kozlowski |