Pseudomonas phage JG054
Taxonomy: Viruses; Duplodnaviria; Heunggongvirae; Uroviricota; Caudoviricetes; Caudovirales; Siphoviridae; Queuovirinae; Nipunavirus; unclassified Nipunavirus
Average proteome isoelectric point is 6.39
Get precalculated fractions of proteins
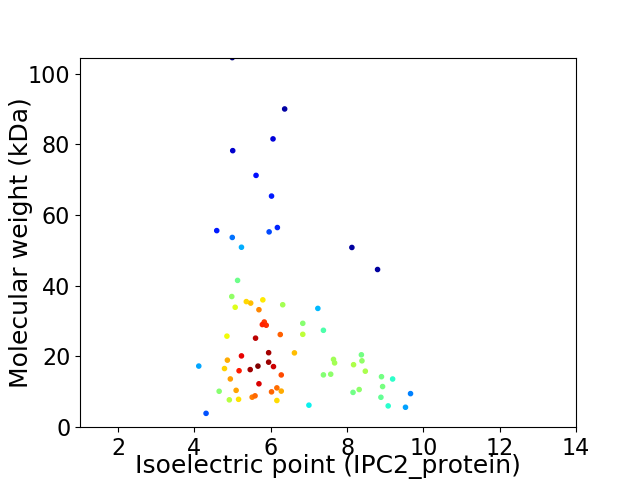
Virtual 2D-PAGE plot for 74 proteins (isoelectric point calculated using IPC2_protein)
Get csv file with sequences according to given criteria:
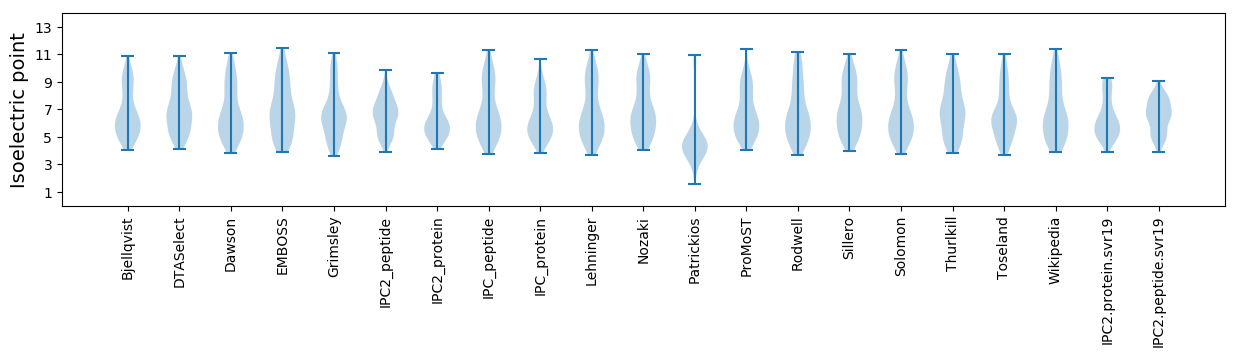
* You can choose from 21 different methods for calculating isoelectric point
Summary statistics related to proteome-wise predictions
Protein with the lowest isoelectric point:
>tr|A0A2H4GY99|A0A2H4GY99_9CAUD Uncharacterized protein OS=Pseudomonas phage JG054 OX=1970800 GN=JG054_00055 PE=4 SV=1
MM1 pKa = 7.79CEE3 pKa = 5.04LDD5 pKa = 5.51DD6 pKa = 4.6PMAPARR12 pKa = 11.84GIVNGVLFSIPLWAVIIAVAYY33 pKa = 7.27WALL36 pKa = 3.44
MM1 pKa = 7.79CEE3 pKa = 5.04LDD5 pKa = 5.51DD6 pKa = 4.6PMAPARR12 pKa = 11.84GIVNGVLFSIPLWAVIIAVAYY33 pKa = 7.27WALL36 pKa = 3.44
Molecular weight: 3.92 kDa
Isoelectric point according different methods:
Protein with the highest isoelectric point:
>tr|A0A2H4GYC5|A0A2H4GYC5_9CAUD Putative exonuclease RecB OS=Pseudomonas phage JG054 OX=1970800 GN=JG054_00042 PE=4 SV=1
MM1 pKa = 7.65IPRR4 pKa = 11.84FPMSPEE10 pKa = 3.45TAKK13 pKa = 11.02AIMEE17 pKa = 3.96EE18 pKa = 4.05HH19 pKa = 5.72EE20 pKa = 4.31RR21 pKa = 11.84RR22 pKa = 11.84RR23 pKa = 11.84KK24 pKa = 9.83ARR26 pKa = 11.84EE27 pKa = 3.31EE28 pKa = 3.79RR29 pKa = 11.84KK30 pKa = 9.46RR31 pKa = 11.84AKK33 pKa = 10.4LLAKK37 pKa = 9.83EE38 pKa = 4.36LEE40 pKa = 4.04AALRR44 pKa = 11.84GEE46 pKa = 4.29QGPAQPRR53 pKa = 11.84AYY55 pKa = 8.66WRR57 pKa = 11.84WPMGIGAHH65 pKa = 6.95AIALAAIAAAALLGWLLLRR84 pKa = 5.08
MM1 pKa = 7.65IPRR4 pKa = 11.84FPMSPEE10 pKa = 3.45TAKK13 pKa = 11.02AIMEE17 pKa = 3.96EE18 pKa = 4.05HH19 pKa = 5.72EE20 pKa = 4.31RR21 pKa = 11.84RR22 pKa = 11.84RR23 pKa = 11.84KK24 pKa = 9.83ARR26 pKa = 11.84EE27 pKa = 3.31EE28 pKa = 3.79RR29 pKa = 11.84KK30 pKa = 9.46RR31 pKa = 11.84AKK33 pKa = 10.4LLAKK37 pKa = 9.83EE38 pKa = 4.36LEE40 pKa = 4.04AALRR44 pKa = 11.84GEE46 pKa = 4.29QGPAQPRR53 pKa = 11.84AYY55 pKa = 8.66WRR57 pKa = 11.84WPMGIGAHH65 pKa = 6.95AIALAAIAAAALLGWLLLRR84 pKa = 5.08
Molecular weight: 9.5 kDa
Isoelectric point according different methods:
Peptides (in silico digests for buttom-up proteomics)
Below you can find in silico digests of the whole proteome with Trypsin, Chymotrypsin, Trypsin+LysC, LysN, ArgC proteases suitable for different mass spec machines.| Try ESI |
 |
|---|
| ChTry ESI |
|
|---|
| ArgC ESI |
|
|---|
| LysN ESI |
|
|---|
| TryLysC ESI |
|
|---|
| Try MALDI |
|
|---|
| ChTry MALDI |
|
|---|
| ArgC MALDI |
|
|---|
| LysN MALDI |
|
|---|
| TryLysC MALDI |
|
|---|
| Try LTQ |
|
|---|
| ChTry LTQ |
|
|---|
| ArgC LTQ |
|
|---|
| LysN LTQ |
|
|---|
| TryLysC LTQ |
|
|---|
| Try MSlow |
|
|---|
| ChTry MSlow |
|
|---|
| ArgC MSlow |
|
|---|
| LysN MSlow |
|
|---|
| TryLysC MSlow |
|
|---|
| Try MShigh |
|
|---|
| ChTry MShigh |
|
|---|
| ArgC MShigh |
|
|---|
| LysN MShigh |
|
|---|
| TryLysC MShigh |
|
|---|
General Statistics
Number of major isoforms |
Number of additional isoforms |
Number of all proteins |
Number of amino acids |
Min. Seq. Length |
Max. Seq. Length |
Avg. Seq. Length |
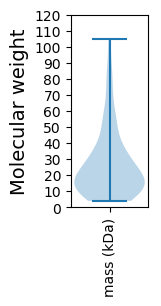
Avg. Mol. Weight |
|---|---|---|---|---|---|---|---|
0 |
18091 |
36 |
976 |
244.5 |
27.02 |
Amino acid frequency
Ala |
Cys |
Asp |
Glu |
Phe |
Gly |
His |
Ile |
Lys |
Leu |
|---|---|---|---|---|---|---|---|---|---|
10.652 ± 0.412 | 1.205 ± 0.155 |
5.804 ± 0.181 | 6.042 ± 0.283 |
3.56 ± 0.148 | 7.705 ± 0.287 |
2.001 ± 0.199 | 5.08 ± 0.184 |
4.82 ± 0.22 | 8.181 ± 0.258 |
Met |
Asn |
Gln |
Pro |
Arg |
Ser |
Thr |
Val |
Trp |
Tyr |
|---|---|---|---|---|---|---|---|---|---|
2.747 ± 0.138 | 3.908 ± 0.163 |
4.676 ± 0.264 | 4.643 ± 0.36 |
5.986 ± 0.241 | 5.622 ± 0.237 |
5.826 ± 0.292 | 6.793 ± 0.244 |
1.763 ± 0.131 | 2.985 ± 0.181 |
Most of the basic statistics you can see at this page can be downloaded from this CSV file
See this proteome in:

Proteome-pI is available under Creative Commons Attribution-NoDerivs license, for more details see here
| Reference: Kozlowski LP. Proteome-pI 2.0: Proteome Isoelectric Point Database Update. Nucleic Acids Res. 2021, doi: 10.1093/nar/gkab944 | Contact: Lukasz P. Kozlowski |