Bombyx mandarina nucleopolyhedrovirus
Taxonomy: Viruses; Naldaviricetes; Lefavirales; Baculoviridae; Alphabaculovirus; Bombyx mori nucleopolyhedrovirus
Average proteome isoelectric point is 6.9
Get precalculated fractions of proteins
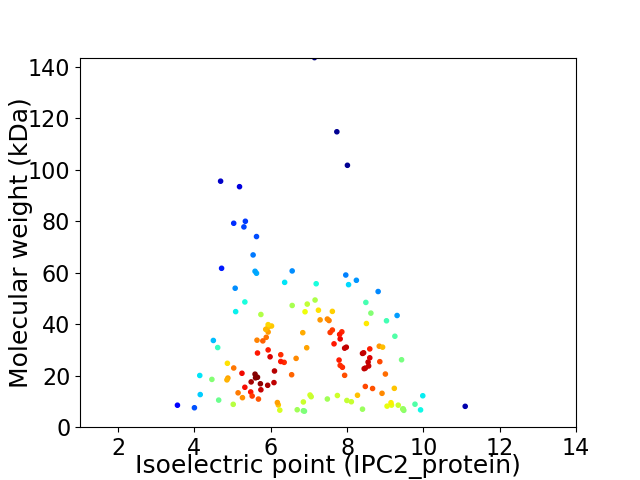
Virtual 2D-PAGE plot for 141 proteins (isoelectric point calculated using IPC2_protein)
Get csv file with sequences according to given criteria:
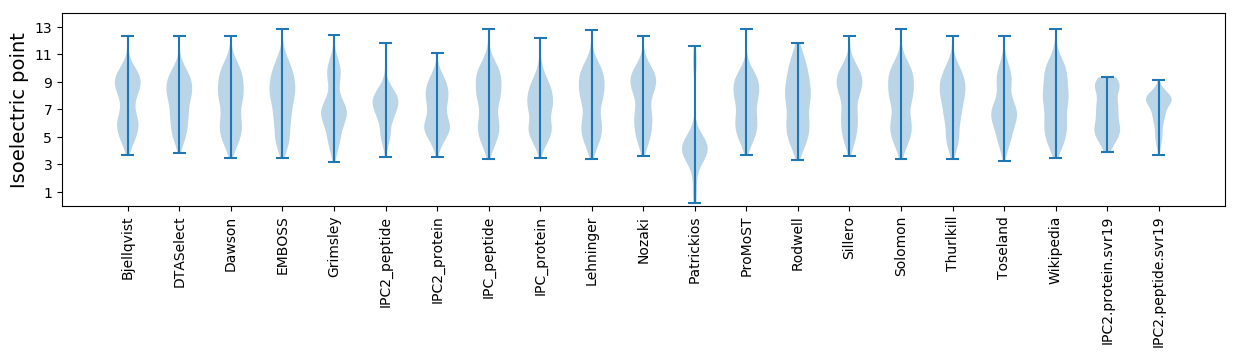
* You can choose from 21 different methods for calculating isoelectric point
Summary statistics related to proteome-wise predictions
Protein with the lowest isoelectric point:
>tr|C3VNV1|C3VNV1_NPVBM VP1054 OS=Bombyx mandarina nucleopolyhedrovirus OX=640862 PE=4 SV=1
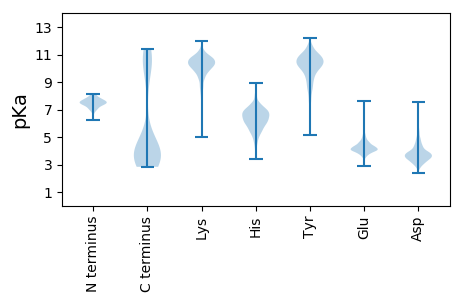
MM1 pKa = 7.0TNVWSAADD9 pKa = 3.56VNLINCVLKK18 pKa = 11.16DD19 pKa = 3.72NLFLINNNYY28 pKa = 9.84IILNVFDD35 pKa = 4.36QEE37 pKa = 4.17TDD39 pKa = 3.26QVRR42 pKa = 11.84PLCLGEE48 pKa = 4.21INAFQTDD55 pKa = 3.22AAAQADD61 pKa = 3.89AMLDD65 pKa = 3.42TSSTSEE71 pKa = 4.07LQSNASTT78 pKa = 3.69
MM1 pKa = 7.0TNVWSAADD9 pKa = 3.56VNLINCVLKK18 pKa = 11.16DD19 pKa = 3.72NLFLINNNYY28 pKa = 9.84IILNVFDD35 pKa = 4.36QEE37 pKa = 4.17TDD39 pKa = 3.26QVRR42 pKa = 11.84PLCLGEE48 pKa = 4.21INAFQTDD55 pKa = 3.22AAAQADD61 pKa = 3.89AMLDD65 pKa = 3.42TSSTSEE71 pKa = 4.07LQSNASTT78 pKa = 3.69
Molecular weight: 8.54 kDa
Isoelectric point according different methods:
Protein with the highest isoelectric point:
>tr|C3VNU2|C3VNU2_NPVBM Ac44-like protein OS=Bombyx mandarina nucleopolyhedrovirus OX=640862 PE=4 SV=1
MM1 pKa = 6.3NTRR4 pKa = 11.84YY5 pKa = 7.93ATCYY9 pKa = 9.91VCDD12 pKa = 3.58EE13 pKa = 4.24LVYY16 pKa = 10.75LFKK19 pKa = 10.53KK20 pKa = 8.59TFSNMSPSAAAFYY33 pKa = 7.6QQRR36 pKa = 11.84MAIVKK41 pKa = 10.1NGIVLCVRR49 pKa = 11.84CSSKK53 pKa = 11.02LKK55 pKa = 9.96IGNGISIPIYY65 pKa = 8.82PNRR68 pKa = 11.84RR69 pKa = 11.84AQQHH73 pKa = 4.95ARR75 pKa = 11.84RR76 pKa = 11.84SRR78 pKa = 3.12
MM1 pKa = 6.3NTRR4 pKa = 11.84YY5 pKa = 7.93ATCYY9 pKa = 9.91VCDD12 pKa = 3.58EE13 pKa = 4.24LVYY16 pKa = 10.75LFKK19 pKa = 10.53KK20 pKa = 8.59TFSNMSPSAAAFYY33 pKa = 7.6QQRR36 pKa = 11.84MAIVKK41 pKa = 10.1NGIVLCVRR49 pKa = 11.84CSSKK53 pKa = 11.02LKK55 pKa = 9.96IGNGISIPIYY65 pKa = 8.82PNRR68 pKa = 11.84RR69 pKa = 11.84AQQHH73 pKa = 4.95ARR75 pKa = 11.84RR76 pKa = 11.84SRR78 pKa = 3.12
Molecular weight: 8.94 kDa
Isoelectric point according different methods:
Peptides (in silico digests for buttom-up proteomics)
Below you can find in silico digests of the whole proteome with Trypsin, Chymotrypsin, Trypsin+LysC, LysN, ArgC proteases suitable for different mass spec machines.| Try ESI |
 |
|---|
| ChTry ESI |
|
|---|
| ArgC ESI |
|
|---|
| LysN ESI |
|
|---|
| TryLysC ESI |
|
|---|
| Try MALDI |
|
|---|
| ChTry MALDI |
|
|---|
| ArgC MALDI |
|
|---|
| LysN MALDI |
|
|---|
| TryLysC MALDI |
|
|---|
| Try LTQ |
|
|---|
| ChTry LTQ |
|
|---|
| ArgC LTQ |
|
|---|
| LysN LTQ |
|
|---|
| TryLysC LTQ |
|
|---|
| Try MSlow |
|
|---|
| ChTry MSlow |
|
|---|
| ArgC MSlow |
|
|---|
| LysN MSlow |
|
|---|
| TryLysC MSlow |
|
|---|
| Try MShigh |
|
|---|
| ChTry MShigh |
|
|---|
| ArgC MShigh |
|
|---|
| LysN MShigh |
|
|---|
| TryLysC MShigh |
|
|---|
General Statistics
Number of major isoforms |
Number of additional isoforms |
Number of all proteins |
Number of amino acids |
Min. Seq. Length |
Max. Seq. Length |
Avg. Seq. Length |
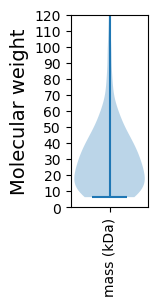
Avg. Mol. Weight |
|---|---|---|---|---|---|---|---|
0 |
38425 |
53 |
1222 |
272.5 |
31.46 |
Amino acid frequency
Ala |
Cys |
Asp |
Glu |
Phe |
Gly |
His |
Ile |
Lys |
Leu |
|---|---|---|---|---|---|---|---|---|---|
5.195 ± 0.187 | 2.392 ± 0.146 |
6.072 ± 0.149 | 5.327 ± 0.158 |
4.937 ± 0.125 | 3.323 ± 0.194 |
2.209 ± 0.1 | 6.576 ± 0.105 |
7.196 ± 0.239 | 9.286 ± 0.149 |
Met |
Asn |
Gln |
Pro |
Arg |
Ser |
Thr |
Val |
Trp |
Tyr |
|---|---|---|---|---|---|---|---|---|---|
2.774 ± 0.087 | 8.234 ± 0.179 |
3.844 ± 0.197 | 3.724 ± 0.173 |
4.721 ± 0.18 | 6.23 ± 0.16 |
5.819 ± 0.15 | 6.605 ± 0.13 |
0.747 ± 0.067 | 4.789 ± 0.106 |
Most of the basic statistics you can see at this page can be downloaded from this CSV file
See this proteome in:

Proteome-pI is available under Creative Commons Attribution-NoDerivs license, for more details see here
| Reference: Kozlowski LP. Proteome-pI 2.0: Proteome Isoelectric Point Database Update. Nucleic Acids Res. 2021, doi: 10.1093/nar/gkab944 | Contact: Lukasz P. Kozlowski |