Hymenobacter actinosclerus
Taxonomy: cellular organisms; Bacteria; FCB group; Bacteroidetes/Chlorobi group; Bacteroidetes; Cytophagia; Cytophagales; Hymenobacteraceae; Hymenobacter
Average proteome isoelectric point is 6.91
Get precalculated fractions of proteins
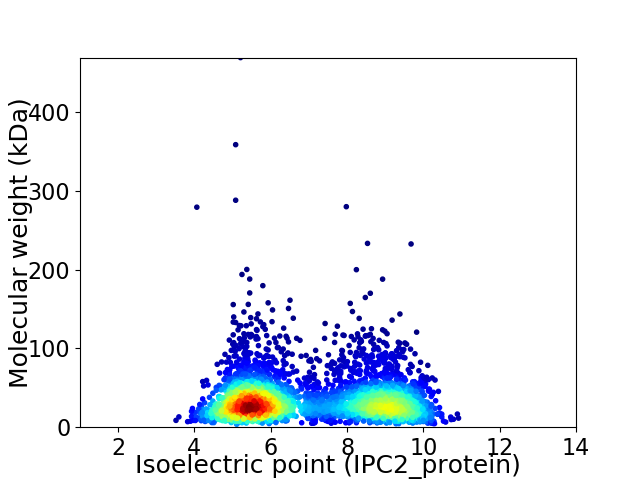
Virtual 2D-PAGE plot for 3677 proteins (isoelectric point calculated using IPC2_protein)
Get csv file with sequences according to given criteria:
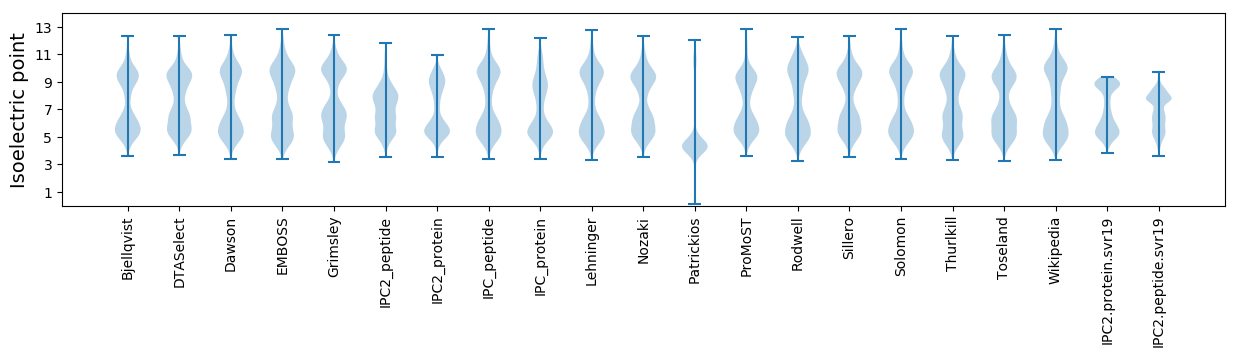
* You can choose from 21 different methods for calculating isoelectric point
Summary statistics related to proteome-wise predictions
Protein with the lowest isoelectric point:
>tr|A0A1I0GZR0|A0A1I0GZR0_9BACT Uncharacterized protein OS=Hymenobacter actinosclerus OX=82805 GN=SAMN04487998_2675 PE=4 SV=1
MM1 pKa = 7.72LSTHH5 pKa = 6.57HH6 pKa = 6.96PAGLPPAADD15 pKa = 3.85LQRR18 pKa = 11.84LGQALAMLDD27 pKa = 4.6AINSPDD33 pKa = 3.49PEE35 pKa = 4.19YY36 pKa = 10.62RR37 pKa = 11.84YY38 pKa = 8.84YY39 pKa = 10.62TYY41 pKa = 10.82DD42 pKa = 3.46PHH44 pKa = 7.35WDD46 pKa = 3.32ADD48 pKa = 3.97EE49 pKa = 4.5QLLEE53 pKa = 4.22MNDD56 pKa = 3.96GEE58 pKa = 4.62GDD60 pKa = 3.44QLLVLFRR67 pKa = 11.84PEE69 pKa = 4.16GCCINGSLSGHH80 pKa = 5.89EE81 pKa = 4.22PADD84 pKa = 3.55KK85 pKa = 10.74KK86 pKa = 10.97QLTRR90 pKa = 11.84GLPAAFEE97 pKa = 4.06EE98 pKa = 5.0FMFGEE103 pKa = 4.57PVEE106 pKa = 4.76SIGTSFCLWYY116 pKa = 9.45TPAHH120 pKa = 6.12GWQTGVVDD128 pKa = 3.85EE129 pKa = 5.43AEE131 pKa = 4.71DD132 pKa = 4.47DD133 pKa = 4.1GSEE136 pKa = 3.92DD137 pKa = 3.78LMAIFDD143 pKa = 4.34QNPEE147 pKa = 4.21TYY149 pKa = 10.94ADD151 pKa = 3.69WANGYY156 pKa = 9.57YY157 pKa = 10.18LDD159 pKa = 3.8EE160 pKa = 4.55TEE162 pKa = 5.17RR163 pKa = 11.84EE164 pKa = 4.12PLEE167 pKa = 4.29TADD170 pKa = 3.21VARR173 pKa = 11.84FYY175 pKa = 10.77QHH177 pKa = 6.84EE178 pKa = 4.75PLTQATAQALNPDD191 pKa = 3.73LTDD194 pKa = 3.59WPQLAADD201 pKa = 4.83AEE203 pKa = 4.74QIGYY207 pKa = 8.49PHH209 pKa = 6.83EE210 pKa = 4.59LKK212 pKa = 10.9SS213 pKa = 3.48
MM1 pKa = 7.72LSTHH5 pKa = 6.57HH6 pKa = 6.96PAGLPPAADD15 pKa = 3.85LQRR18 pKa = 11.84LGQALAMLDD27 pKa = 4.6AINSPDD33 pKa = 3.49PEE35 pKa = 4.19YY36 pKa = 10.62RR37 pKa = 11.84YY38 pKa = 8.84YY39 pKa = 10.62TYY41 pKa = 10.82DD42 pKa = 3.46PHH44 pKa = 7.35WDD46 pKa = 3.32ADD48 pKa = 3.97EE49 pKa = 4.5QLLEE53 pKa = 4.22MNDD56 pKa = 3.96GEE58 pKa = 4.62GDD60 pKa = 3.44QLLVLFRR67 pKa = 11.84PEE69 pKa = 4.16GCCINGSLSGHH80 pKa = 5.89EE81 pKa = 4.22PADD84 pKa = 3.55KK85 pKa = 10.74KK86 pKa = 10.97QLTRR90 pKa = 11.84GLPAAFEE97 pKa = 4.06EE98 pKa = 5.0FMFGEE103 pKa = 4.57PVEE106 pKa = 4.76SIGTSFCLWYY116 pKa = 9.45TPAHH120 pKa = 6.12GWQTGVVDD128 pKa = 3.85EE129 pKa = 5.43AEE131 pKa = 4.71DD132 pKa = 4.47DD133 pKa = 4.1GSEE136 pKa = 3.92DD137 pKa = 3.78LMAIFDD143 pKa = 4.34QNPEE147 pKa = 4.21TYY149 pKa = 10.94ADD151 pKa = 3.69WANGYY156 pKa = 9.57YY157 pKa = 10.18LDD159 pKa = 3.8EE160 pKa = 4.55TEE162 pKa = 5.17RR163 pKa = 11.84EE164 pKa = 4.12PLEE167 pKa = 4.29TADD170 pKa = 3.21VARR173 pKa = 11.84FYY175 pKa = 10.77QHH177 pKa = 6.84EE178 pKa = 4.75PLTQATAQALNPDD191 pKa = 3.73LTDD194 pKa = 3.59WPQLAADD201 pKa = 4.83AEE203 pKa = 4.74QIGYY207 pKa = 8.49PHH209 pKa = 6.83EE210 pKa = 4.59LKK212 pKa = 10.9SS213 pKa = 3.48
Molecular weight: 23.81 kDa
Isoelectric point according different methods:
Protein with the highest isoelectric point:
>tr|A0A1I0J2E3|A0A1I0J2E3_9BACT NTE family protein OS=Hymenobacter actinosclerus OX=82805 GN=SAMN04487998_3617 PE=4 SV=1
MM1 pKa = 6.81RR2 pKa = 11.84TSRR5 pKa = 11.84RR6 pKa = 11.84FRR8 pKa = 11.84WLKK11 pKa = 10.79AKK13 pKa = 10.44LAGALVLLTLVAWGSWQEE31 pKa = 3.92PSLHH35 pKa = 6.41EE36 pKa = 4.08FTPVTEE42 pKa = 4.82FVTLTAPDD50 pKa = 4.23LQPGAAAEE58 pKa = 3.95QLQARR63 pKa = 11.84ALALPGVTACAVRR76 pKa = 11.84PEE78 pKa = 4.15KK79 pKa = 10.5QLLTLAYY86 pKa = 9.94RR87 pKa = 11.84PAEE90 pKa = 3.95LSAGQLQQRR99 pKa = 11.84LNLSALPQPEE109 pKa = 4.4LSAEE113 pKa = 3.9AAARR117 pKa = 11.84QCPVPPGYY125 pKa = 10.5VQALEE130 pKa = 4.0RR131 pKa = 11.84LRR133 pKa = 11.84FAFNLRR139 pKa = 11.84RR140 pKa = 11.84LFVRR144 pKa = 11.84LL145 pKa = 3.43
MM1 pKa = 6.81RR2 pKa = 11.84TSRR5 pKa = 11.84RR6 pKa = 11.84FRR8 pKa = 11.84WLKK11 pKa = 10.79AKK13 pKa = 10.44LAGALVLLTLVAWGSWQEE31 pKa = 3.92PSLHH35 pKa = 6.41EE36 pKa = 4.08FTPVTEE42 pKa = 4.82FVTLTAPDD50 pKa = 4.23LQPGAAAEE58 pKa = 3.95QLQARR63 pKa = 11.84ALALPGVTACAVRR76 pKa = 11.84PEE78 pKa = 4.15KK79 pKa = 10.5QLLTLAYY86 pKa = 9.94RR87 pKa = 11.84PAEE90 pKa = 3.95LSAGQLQQRR99 pKa = 11.84LNLSALPQPEE109 pKa = 4.4LSAEE113 pKa = 3.9AAARR117 pKa = 11.84QCPVPPGYY125 pKa = 10.5VQALEE130 pKa = 4.0RR131 pKa = 11.84LRR133 pKa = 11.84FAFNLRR139 pKa = 11.84RR140 pKa = 11.84LFVRR144 pKa = 11.84LL145 pKa = 3.43
Molecular weight: 16.05 kDa
Isoelectric point according different methods:
Peptides (in silico digests for buttom-up proteomics)
Below you can find in silico digests of the whole proteome with Trypsin, Chymotrypsin, Trypsin+LysC, LysN, ArgC proteases suitable for different mass spec machines.| Try ESI |
 |
|---|
| ChTry ESI |
|
|---|
| ArgC ESI |
|
|---|
| LysN ESI |
|
|---|
| TryLysC ESI |
|
|---|
| Try MALDI |
|
|---|
| ChTry MALDI |
|
|---|
| ArgC MALDI |
|
|---|
| LysN MALDI |
|
|---|
| TryLysC MALDI |
|
|---|
| Try LTQ |
|
|---|
| ChTry LTQ |
|
|---|
| ArgC LTQ |
|
|---|
| LysN LTQ |
|
|---|
| TryLysC LTQ |
|
|---|
| Try MSlow |
|
|---|
| ChTry MSlow |
|
|---|
| ArgC MSlow |
|
|---|
| LysN MSlow |
|
|---|
| TryLysC MSlow |
|
|---|
| Try MShigh |
|
|---|
| ChTry MShigh |
|
|---|
| ArgC MShigh |
|
|---|
| LysN MShigh |
|
|---|
| TryLysC MShigh |
|
|---|
General Statistics
Number of major isoforms |
Number of additional isoforms |
Number of all proteins |
Number of amino acids |
Min. Seq. Length |
Max. Seq. Length |
Avg. Seq. Length |
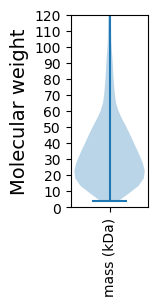
Avg. Mol. Weight |
|---|---|---|---|---|---|---|---|
0 |
1251588 |
37 |
4250 |
340.4 |
37.48 |
Amino acid frequency
Ala |
Cys |
Asp |
Glu |
Phe |
Gly |
His |
Ile |
Lys |
Leu |
|---|---|---|---|---|---|---|---|---|---|
10.915 ± 0.059 | 0.678 ± 0.011 |
4.962 ± 0.03 | 5.416 ± 0.04 |
4.007 ± 0.022 | 7.649 ± 0.04 |
1.994 ± 0.021 | 4.194 ± 0.039 |
3.725 ± 0.042 | 11.545 ± 0.065 |
Met |
Asn |
Gln |
Pro |
Arg |
Ser |
Thr |
Val |
Trp |
Tyr |
|---|---|---|---|---|---|---|---|---|---|
1.841 ± 0.019 | 3.536 ± 0.034 |
5.458 ± 0.034 | 4.728 ± 0.032 |
6.531 ± 0.038 | 5.296 ± 0.03 |
5.939 ± 0.043 | 6.988 ± 0.032 |
1.186 ± 0.016 | 3.412 ± 0.024 |
Most of the basic statistics you can see at this page can be downloaded from this CSV file
See this proteome in:

Proteome-pI is available under Creative Commons Attribution-NoDerivs license, for more details see here
| Reference: Kozlowski LP. Proteome-pI 2.0: Proteome Isoelectric Point Database Update. Nucleic Acids Res. 2021, doi: 10.1093/nar/gkab944 | Contact: Lukasz P. Kozlowski |