Phoenicopterus ruber ruber
Taxonomy: cellular organisms; Eukaryota; Opisthokonta; Metazoa; Eumetazoa; Bilateria; Deuterostomia; Chordata; Craniata; Vertebrata; Gnathostomata; Teleostomi; Euteleostomi; Sarcopterygii; Dipnotetrapodomorpha; Tetrapoda; Amniota; Sauropsida; Sauria; Archelosauria; Archosauria; Dinosauria; Saurischia; Theropoda; Coe
Average proteome isoelectric point is 6.69
Get precalculated fractions of proteins
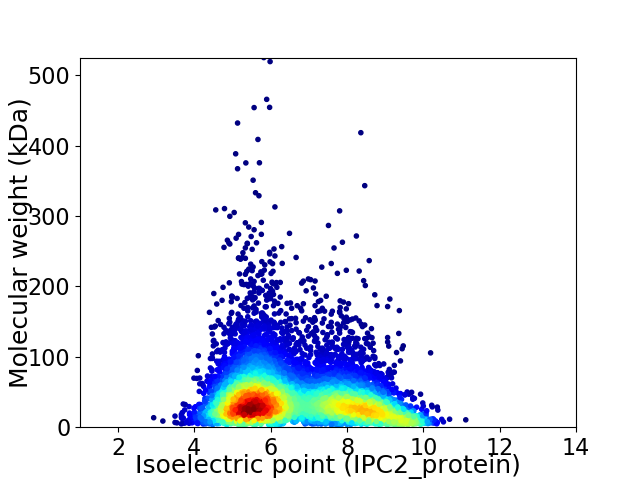
Virtual 2D-PAGE plot for 8220 proteins (isoelectric point calculated using IPC2_protein)
Get csv file with sequences according to given criteria:
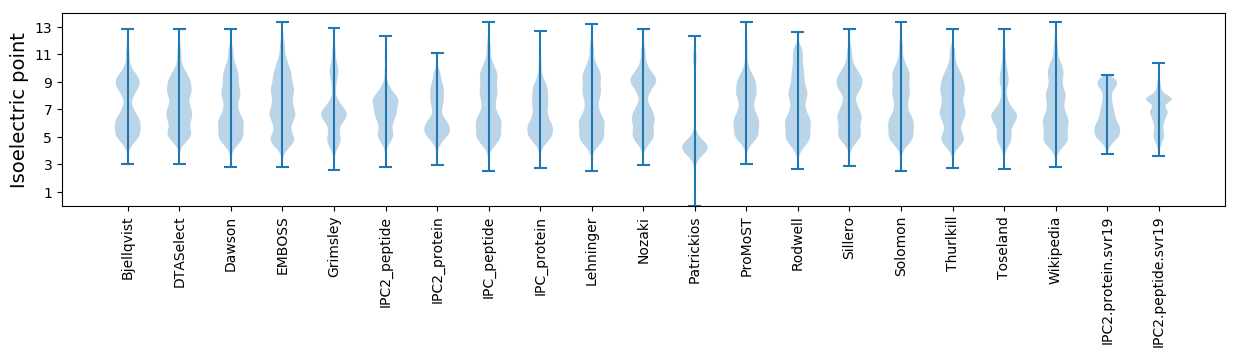
* You can choose from 21 different methods for calculating isoelectric point
Summary statistics related to proteome-wise predictions
Protein with the lowest isoelectric point:
>tr|A0A091TU11|A0A091TU11_PHORB Mitochondrial glutamate carrier 1 (Fragment) OS=Phoenicopterus ruber ruber OX=9218 GN=N337_04182 PE=3 SV=1
DDD2 pKa = 4.19QSLPGLANVDDD13 pKa = 4.79SAQNPNIQVTIEEE26 pKa = 4.15VDDD29 pKa = 4.31DD30 pKa = 4.17QAEEE34 pKa = 4.2EEE36 pKa = 4.1DDD38 pKa = 3.99LKKK41 pKa = 10.12EE42 pKa = 4.19SNDDD46 pKa = 2.88SLTSSEEE53 pKa = 4.14LSHHH57 pKa = 7.2KK58 pKa = 10.8DD59 pKa = 3.65FWPLFWEEE67 pKa = 4.38YY68 pKa = 10.58DDD70 pKa = 3.68AEEE73 pKa = 4.28EE74 pKa = 4.14EE75 pKa = 4.18EE76 pKa = 4.36EE77 pKa = 4.18EE78 pKa = 4.26EE79 pKa = 4.41EE80 pKa = 5.32EE81 pKa = 5.2EE82 pKa = 5.12EE83 pKa = 4.63EE84 pKa = 5.57DD85 pKa = 5.08DD86 pKa = 4.82LDDD89 pKa = 3.38GDDD92 pKa = 3.97DDD94 pKa = 3.67EE95 pKa = 4.78EE96 pKa = 4.27EE97 pKa = 4.23EE98 pKa = 4.15EE99 pKa = 4.17EE100 pKa = 4.26EE101 pKa = 4.18EE102 pKa = 4.21EE103 pKa = 4.21EE104 pKa = 4.21EE105 pKa = 4.21EE106 pKa = 4.21EE107 pKa = 4.21EE108 pKa = 4.21EE109 pKa = 4.32EE110 pKa = 4.28EE111 pKa = 4.87EE112 pKa = 4.62EE113 pKa = 4.43EE114 pKa = 3.89EE115 pKa = 5.43DD116 pKa = 3.53YY117 pKa = 10.46AEEE120 pKa = 4.11YY121 pKa = 10.59EE122 pKa = 4.36EE123 pKa = 4.71EE124 pKa = 4.02EE125 pKa = 4.51MLSGVGGDDD134 pKa = 3.46DDD136 pKa = 4.48RR137 pKa = 11.84WPGQKKK143 pKa = 9.55WIFKKK148 pKa = 10.0EE149 pKa = 4.0KK150 pKa = 10.83YY151 pKa = 8.82YYY153 pKa = 10.35DD154 pKa = 3.76YY155 pKa = 11.17EE156 pKa = 5.81DD157 pKa = 3.87EE158 pKa = 4.87EE159 pKa = 4.71EE160 pKa = 4.04SPWSPCSITCGSGNQKKK177 pKa = 8.36TRR179 pKa = 11.84SCGYYY184 pKa = 9.46CTATEEE190 pKa = 5.26RR191 pKa = 11.84TCDDD195 pKa = 3.49PHHH198 pKa = 7.0PGAEEE203 pKa = 3.73EEE205 pKa = 4.48VFPTEEE211 pKa = 3.84EE212 pKa = 4.21PFKKK216 pKa = 10.91DDD218 pKa = 2.8TTEEE222 pKa = 4.22FNSEEE227 pKa = 3.77DDD229 pKa = 4.04CEEE232 pKa = 3.23KK233 pKa = 9.96LNCKKK238 pKa = 10.19DDD240 pKa = 3.71LTKKK244 pKa = 10.51YY245 pKa = 9.97SKKK248 pKa = 11.0LTDDD252 pKa = 5.3PSCPCSYYY260 pKa = 10.29LEEE263 pKa = 4.37VYYY266 pKa = 10.72AVNLQDDD273 pKa = 3.34EE274 pKa = 4.8QGK
DDD2 pKa = 4.19QSLPGLANVDDD13 pKa = 4.79SAQNPNIQVTIEEE26 pKa = 4.15VDDD29 pKa = 4.31DD30 pKa = 4.17QAEEE34 pKa = 4.2EEE36 pKa = 4.1DDD38 pKa = 3.99LKKK41 pKa = 10.12EE42 pKa = 4.19SNDDD46 pKa = 2.88SLTSSEEE53 pKa = 4.14LSHHH57 pKa = 7.2KK58 pKa = 10.8DD59 pKa = 3.65FWPLFWEEE67 pKa = 4.38YY68 pKa = 10.58DDD70 pKa = 3.68AEEE73 pKa = 4.28EE74 pKa = 4.14EE75 pKa = 4.18EE76 pKa = 4.36EE77 pKa = 4.18EE78 pKa = 4.26EE79 pKa = 4.41EE80 pKa = 5.32EE81 pKa = 5.2EE82 pKa = 5.12EE83 pKa = 4.63EE84 pKa = 5.57DD85 pKa = 5.08DD86 pKa = 4.82LDDD89 pKa = 3.38GDDD92 pKa = 3.97DDD94 pKa = 3.67EE95 pKa = 4.78EE96 pKa = 4.27EE97 pKa = 4.23EE98 pKa = 4.15EE99 pKa = 4.17EE100 pKa = 4.26EE101 pKa = 4.18EE102 pKa = 4.21EE103 pKa = 4.21EE104 pKa = 4.21EE105 pKa = 4.21EE106 pKa = 4.21EE107 pKa = 4.21EE108 pKa = 4.21EE109 pKa = 4.32EE110 pKa = 4.28EE111 pKa = 4.87EE112 pKa = 4.62EE113 pKa = 4.43EE114 pKa = 3.89EE115 pKa = 5.43DD116 pKa = 3.53YY117 pKa = 10.46AEEE120 pKa = 4.11YY121 pKa = 10.59EE122 pKa = 4.36EE123 pKa = 4.71EE124 pKa = 4.02EE125 pKa = 4.51MLSGVGGDDD134 pKa = 3.46DDD136 pKa = 4.48RR137 pKa = 11.84WPGQKKK143 pKa = 9.55WIFKKK148 pKa = 10.0EE149 pKa = 4.0KK150 pKa = 10.83YY151 pKa = 8.82YYY153 pKa = 10.35DD154 pKa = 3.76YY155 pKa = 11.17EE156 pKa = 5.81DD157 pKa = 3.87EE158 pKa = 4.87EE159 pKa = 4.71EE160 pKa = 4.04SPWSPCSITCGSGNQKKK177 pKa = 8.36TRR179 pKa = 11.84SCGYYY184 pKa = 9.46CTATEEE190 pKa = 5.26RR191 pKa = 11.84TCDDD195 pKa = 3.49PHHH198 pKa = 7.0PGAEEE203 pKa = 3.73EEE205 pKa = 4.48VFPTEEE211 pKa = 3.84EE212 pKa = 4.21PFKKK216 pKa = 10.91DDD218 pKa = 2.8TTEEE222 pKa = 4.22FNSEEE227 pKa = 3.77DDD229 pKa = 4.04CEEE232 pKa = 3.23KK233 pKa = 9.96LNCKKK238 pKa = 10.19DDD240 pKa = 3.71LTKKK244 pKa = 10.51YY245 pKa = 9.97SKKK248 pKa = 11.0LTDDD252 pKa = 5.3PSCPCSYYY260 pKa = 10.29LEEE263 pKa = 4.37VYYY266 pKa = 10.72AVNLQDDD273 pKa = 3.34EE274 pKa = 4.8QGK
Molecular weight: 32.16 kDa
Isoelectric point according different methods:
Protein with the highest isoelectric point:
>tr|A0A091UEQ4|A0A091UEQ4_PHORB Mitogen-activated protein kinase kinase kinase 3 (Fragment) OS=Phoenicopterus ruber ruber OX=9218 GN=N337_01822 PE=4 SV=1
TT1 pKa = 6.27QSMRR5 pKa = 11.84VTQSMKK11 pKa = 8.34VTQSMRR17 pKa = 11.84VTQSMKK23 pKa = 8.34VTQSMRR29 pKa = 11.84VTQSMKK35 pKa = 8.34VTQSMRR41 pKa = 11.84VTQSMKK47 pKa = 8.34VTQSMRR53 pKa = 11.84VTQSMKK59 pKa = 8.34VTQSMRR65 pKa = 11.84VTQSMKK71 pKa = 8.34VTQSMRR77 pKa = 11.84VTQSMKK83 pKa = 8.34VTQSMRR89 pKa = 11.84VTT91 pKa = 3.57
TT1 pKa = 6.27QSMRR5 pKa = 11.84VTQSMKK11 pKa = 8.34VTQSMRR17 pKa = 11.84VTQSMKK23 pKa = 8.34VTQSMRR29 pKa = 11.84VTQSMKK35 pKa = 8.34VTQSMRR41 pKa = 11.84VTQSMKK47 pKa = 8.34VTQSMRR53 pKa = 11.84VTQSMKK59 pKa = 8.34VTQSMRR65 pKa = 11.84VTQSMKK71 pKa = 8.34VTQSMRR77 pKa = 11.84VTQSMKK83 pKa = 8.34VTQSMRR89 pKa = 11.84VTT91 pKa = 3.57
Molecular weight: 10.47 kDa
Isoelectric point according different methods:
Peptides (in silico digests for buttom-up proteomics)
Below you can find in silico digests of the whole proteome with Trypsin, Chymotrypsin, Trypsin+LysC, LysN, ArgC proteases suitable for different mass spec machines.| Try ESI |
 |
|---|
| ChTry ESI |
|
|---|
| ArgC ESI |
|
|---|
| LysN ESI |
|
|---|
| TryLysC ESI |
|
|---|
| Try MALDI |
|
|---|
| ChTry MALDI |
|
|---|
| ArgC MALDI |
|
|---|
| LysN MALDI |
|
|---|
| TryLysC MALDI |
|
|---|
| Try LTQ |
|
|---|
| ChTry LTQ |
|
|---|
| ArgC LTQ |
|
|---|
| LysN LTQ |
|
|---|
| TryLysC LTQ |
|
|---|
| Try MSlow |
|
|---|
| ChTry MSlow |
|
|---|
| ArgC MSlow |
|
|---|
| LysN MSlow |
|
|---|
| TryLysC MSlow |
|
|---|
| Try MShigh |
|
|---|
| ChTry MShigh |
|
|---|
| ArgC MShigh |
|
|---|
| LysN MShigh |
|
|---|
| TryLysC MShigh |
|
|---|
General Statistics
Number of major isoforms |
Number of additional isoforms |
Number of all proteins |
Number of amino acids |
Min. Seq. Length |
Max. Seq. Length |
Avg. Seq. Length |
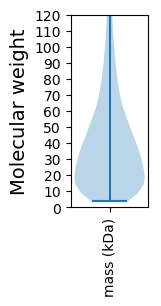
Avg. Mol. Weight |
|---|---|---|---|---|---|---|---|
0 |
3367651 |
31 |
4570 |
409.7 |
46.06 |
Amino acid frequency
Ala |
Cys |
Asp |
Glu |
Phe |
Gly |
His |
Ile |
Lys |
Leu |
|---|---|---|---|---|---|---|---|---|---|
6.36 ± 0.023 | 2.242 ± 0.022 |
5.051 ± 0.019 | 7.226 ± 0.036 |
3.91 ± 0.02 | 5.774 ± 0.033 |
2.519 ± 0.012 | 5.038 ± 0.02 |
6.511 ± 0.036 | 9.698 ± 0.032 |
Met |
Asn |
Gln |
Pro |
Arg |
Ser |
Thr |
Val |
Trp |
Tyr |
|---|---|---|---|---|---|---|---|---|---|
2.246 ± 0.011 | 4.199 ± 0.018 |
5.229 ± 0.031 | 4.672 ± 0.026 |
5.191 ± 0.022 | 8.257 ± 0.04 |
5.413 ± 0.02 | 6.295 ± 0.022 |
1.177 ± 0.01 | 2.99 ± 0.015 |
Most of the basic statistics you can see at this page can be downloaded from this CSV file
See this proteome in:

Proteome-pI is available under Creative Commons Attribution-NoDerivs license, for more details see here
| Reference: Kozlowski LP. Proteome-pI 2.0: Proteome Isoelectric Point Database Update. Nucleic Acids Res. 2021, doi: 10.1093/nar/gkab944 | Contact: Lukasz P. Kozlowski |