Lactococcus phage bIL312
Taxonomy: Viruses; Duplodnaviria; Heunggongvirae; Uroviricota; Caudoviricetes; Caudovirales; Siphoviridae; unclassified Siphoviridae
Average proteome isoelectric point is 6.68
Get precalculated fractions of proteins
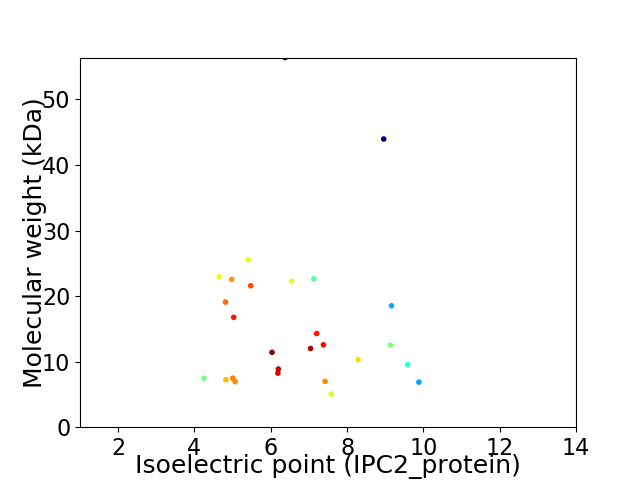
Virtual 2D-PAGE plot for 27 proteins (isoelectric point calculated using IPC2_protein)
Get csv file with sequences according to given criteria:
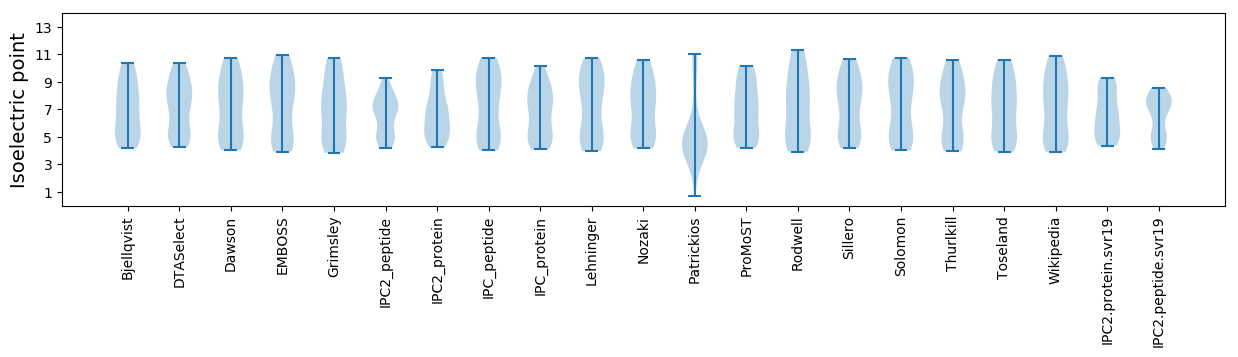
* You can choose from 21 different methods for calculating isoelectric point
Summary statistics related to proteome-wise predictions
Protein with the lowest isoelectric point:
>tr|Q9AZE9|Q9AZE9_9CAUD Orf11 OS=Lactococcus phage bIL312 OX=151539 GN=orf11 PE=4 SV=1
MM1 pKa = 7.84KK2 pKa = 9.41ITIDD6 pKa = 3.51VLEE9 pKa = 4.58NEE11 pKa = 4.49SNKK14 pKa = 10.85DD15 pKa = 3.29NLEE18 pKa = 3.92YY19 pKa = 10.73LISDD23 pKa = 4.45TSNEE27 pKa = 4.32AITVLMFALIGEE39 pKa = 4.42ARR41 pKa = 11.84QRR43 pKa = 11.84ASYY46 pKa = 9.96EE47 pKa = 3.94QFLEE51 pKa = 4.54TITRR55 pKa = 11.84IWGYY59 pKa = 8.96MNEE62 pKa = 4.34DD63 pKa = 3.19NN64 pKa = 5.33
MM1 pKa = 7.84KK2 pKa = 9.41ITIDD6 pKa = 3.51VLEE9 pKa = 4.58NEE11 pKa = 4.49SNKK14 pKa = 10.85DD15 pKa = 3.29NLEE18 pKa = 3.92YY19 pKa = 10.73LISDD23 pKa = 4.45TSNEE27 pKa = 4.32AITVLMFALIGEE39 pKa = 4.42ARR41 pKa = 11.84QRR43 pKa = 11.84ASYY46 pKa = 9.96EE47 pKa = 3.94QFLEE51 pKa = 4.54TITRR55 pKa = 11.84IWGYY59 pKa = 8.96MNEE62 pKa = 4.34DD63 pKa = 3.19NN64 pKa = 5.33
Molecular weight: 7.46 kDa
Isoelectric point according different methods:
Protein with the highest isoelectric point:
>tr|Q9AZD5|Q9AZD5_9CAUD Orf25 OS=Lactococcus phage bIL312 OX=151539 GN=orf25 PE=4 SV=1
MM1 pKa = 7.27LTTRR5 pKa = 11.84EE6 pKa = 3.93QYY8 pKa = 10.84RR9 pKa = 11.84IMKK12 pKa = 10.12LLTKK16 pKa = 9.81HH17 pKa = 5.71YY18 pKa = 9.17KK19 pKa = 9.45SSKK22 pKa = 7.79ITLKK26 pKa = 10.54ILLGRR31 pKa = 11.84VTVGSSCLPQVILRR45 pKa = 11.84SGFFYY50 pKa = 10.44IKK52 pKa = 10.09KK53 pKa = 10.28ALALSQCC60 pKa = 4.01
MM1 pKa = 7.27LTTRR5 pKa = 11.84EE6 pKa = 3.93QYY8 pKa = 10.84RR9 pKa = 11.84IMKK12 pKa = 10.12LLTKK16 pKa = 9.81HH17 pKa = 5.71YY18 pKa = 9.17KK19 pKa = 9.45SSKK22 pKa = 7.79ITLKK26 pKa = 10.54ILLGRR31 pKa = 11.84VTVGSSCLPQVILRR45 pKa = 11.84SGFFYY50 pKa = 10.44IKK52 pKa = 10.09KK53 pKa = 10.28ALALSQCC60 pKa = 4.01
Molecular weight: 6.88 kDa
Isoelectric point according different methods:
Peptides (in silico digests for buttom-up proteomics)
Below you can find in silico digests of the whole proteome with Trypsin, Chymotrypsin, Trypsin+LysC, LysN, ArgC proteases suitable for different mass spec machines.| Try ESI |
 |
|---|
| ChTry ESI |
|
|---|
| ArgC ESI |
|
|---|
| LysN ESI |
|
|---|
| TryLysC ESI |
|
|---|
| Try MALDI |
|
|---|
| ChTry MALDI |
|
|---|
| ArgC MALDI |
|
|---|
| LysN MALDI |
|
|---|
| TryLysC MALDI |
|
|---|
| Try LTQ |
|
|---|
| ChTry LTQ |
|
|---|
| ArgC LTQ |
|
|---|
| LysN LTQ |
|
|---|
| TryLysC LTQ |
|
|---|
| Try MSlow |
|
|---|
| ChTry MSlow |
|
|---|
| ArgC MSlow |
|
|---|
| LysN MSlow |
|
|---|
| TryLysC MSlow |
|
|---|
| Try MShigh |
|
|---|
| ChTry MShigh |
|
|---|
| ArgC MShigh |
|
|---|
| LysN MShigh |
|
|---|
| TryLysC MShigh |
|
|---|
General Statistics
Number of major isoforms |
Number of additional isoforms |
Number of all proteins |
Number of amino acids |
Min. Seq. Length |
Max. Seq. Length |
Avg. Seq. Length |
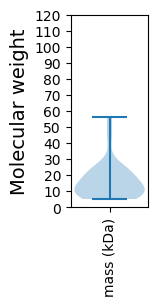
Avg. Mol. Weight |
|---|---|---|---|---|---|---|---|
0 |
3799 |
46 |
480 |
140.7 |
16.3 |
Amino acid frequency
Ala |
Cys |
Asp |
Glu |
Phe |
Gly |
His |
Ile |
Lys |
Leu |
|---|---|---|---|---|---|---|---|---|---|
5.317 ± 0.366 | 0.553 ± 0.107 |
6.344 ± 0.378 | 7.923 ± 0.581 |
4.896 ± 0.396 | 4.685 ± 0.456 |
1.843 ± 0.262 | 7.555 ± 0.511 |
10.634 ± 0.561 | 8.976 ± 0.44 |
Met |
Asn |
Gln |
Pro |
Arg |
Ser |
Thr |
Val |
Trp |
Tyr |
|---|---|---|---|---|---|---|---|---|---|
2.764 ± 0.251 | 6.475 ± 0.357 |
2.29 ± 0.207 | 3.764 ± 0.355 |
3.659 ± 0.378 | 6.37 ± 0.502 |
5.238 ± 0.386 | 5.159 ± 0.296 |
1.158 ± 0.2 | 4.396 ± 0.29 |
Most of the basic statistics you can see at this page can be downloaded from this CSV file
See this proteome in:

Proteome-pI is available under Creative Commons Attribution-NoDerivs license, for more details see here
| Reference: Kozlowski LP. Proteome-pI 2.0: Proteome Isoelectric Point Database Update. Nucleic Acids Res. 2021, doi: 10.1093/nar/gkab944 | Contact: Lukasz P. Kozlowski |