Arundinibacter roseus
Taxonomy: cellular organisms; Bacteria; FCB group; Bacteroidetes/Chlorobi group; Bacteroidetes; Cytophagia; Cytophagales; Cytophagaceae; Arundinibacter
Average proteome isoelectric point is 6.54
Get precalculated fractions of proteins
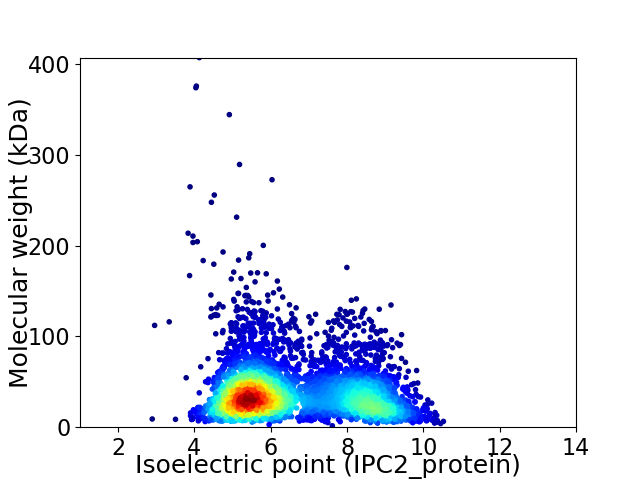
Virtual 2D-PAGE plot for 4679 proteins (isoelectric point calculated using IPC2_protein)
Get csv file with sequences according to given criteria:
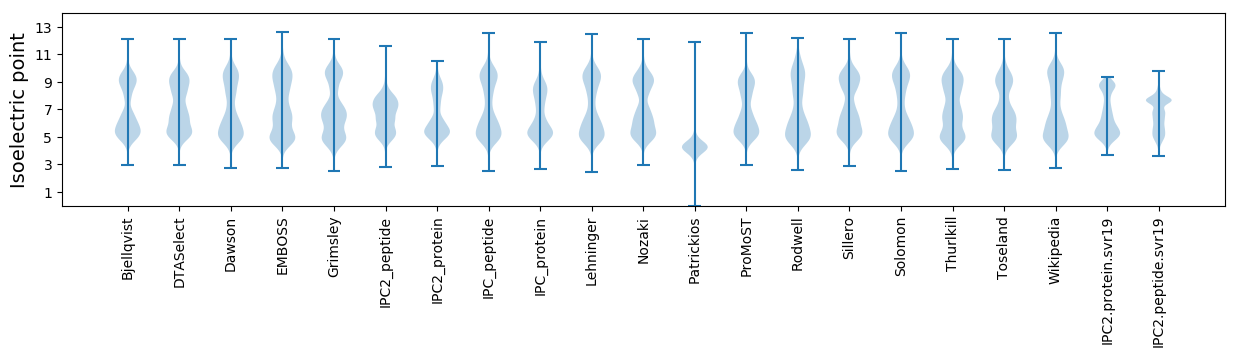
* You can choose from 21 different methods for calculating isoelectric point
Summary statistics related to proteome-wise predictions
Protein with the lowest isoelectric point:
>tr|A0A4R4K275|A0A4R4K275_9BACT Lrp/AsnC family transcriptional regulator OS=Arundinibacter roseus OX=2070510 GN=EZE20_19325 PE=4 SV=1
TT1 pKa = 5.8YY2 pKa = 9.72TPDD5 pKa = 3.56PGFVGEE11 pKa = 6.19DD12 pKa = 3.66VFCYY16 pKa = 10.08AASDD20 pKa = 4.98GIASDD25 pKa = 3.96TACVAVTVQPNPTPANDD42 pKa = 3.85SPLALNDD49 pKa = 3.37NTQTTEE55 pKa = 3.98GTPLSVNVLANDD67 pKa = 3.42VDD69 pKa = 4.18PDD71 pKa = 3.69GDD73 pKa = 3.77ALQNPTVVQAPANGTASVNADD94 pKa = 3.01GTILYY99 pKa = 8.88TPDD102 pKa = 3.54PGFVGTDD109 pKa = 2.9TLTYY113 pKa = 9.67RR114 pKa = 11.84VCDD117 pKa = 3.17TGTPSLCDD125 pKa = 3.24SAQVIVQVLPAPVDD139 pKa = 3.44PAANQAPIAVDD150 pKa = 3.54DD151 pKa = 4.95ANTTTVNTPVTGTVAANDD169 pKa = 3.84SDD171 pKa = 4.5PDD173 pKa = 3.7GDD175 pKa = 4.13ALTFAGLTNPANGTLTVNADD195 pKa = 2.93GSYY198 pKa = 10.79VYY200 pKa = 10.35TPAADD205 pKa = 4.85FIGSDD210 pKa = 3.14VFTYY214 pKa = 7.31TVCDD218 pKa = 3.23NGTPSLCDD226 pKa = 3.0TATVFITVTPVAGKK240 pKa = 10.03VALLPKK246 pKa = 10.28VYY248 pKa = 10.51LQGALFGVFLPDD260 pKa = 2.78TLMRR264 pKa = 11.84DD265 pKa = 3.78DD266 pKa = 5.76LRR268 pKa = 11.84LKK270 pKa = 10.81NLIPTTSPYY279 pKa = 10.69PDD281 pKa = 3.49MGLIGITSANVANITVVNASTTSTNNSIVDD311 pKa = 3.44WVFVEE316 pKa = 4.76LRR318 pKa = 11.84SALDD322 pKa = 3.24STLVLDD328 pKa = 3.99SRR330 pKa = 11.84SALVQRR336 pKa = 11.84DD337 pKa = 3.31GDD339 pKa = 3.84IVEE342 pKa = 4.22VDD344 pKa = 3.63GLSAITFDD352 pKa = 3.68SAVPGSYY359 pKa = 9.94YY360 pKa = 10.53VVVRR364 pKa = 11.84HH365 pKa = 6.09RR366 pKa = 11.84NHH368 pKa = 6.71LGVMSASPIALSTATTVVDD387 pKa = 4.06FRR389 pKa = 11.84KK390 pKa = 10.07AATPTFNLNAASAVNIPQVPVQQGVALWAGNALYY424 pKa = 10.92LNTLDD429 pKa = 4.59SMRR432 pKa = 11.84EE433 pKa = 4.07VIFQGPDD440 pKa = 2.65NDD442 pKa = 3.73VNVIYY447 pKa = 10.24QQVINSPANALFKK460 pKa = 11.29SPFFNLKK467 pKa = 9.89GYY469 pKa = 10.86YY470 pKa = 10.22NGDD473 pKa = 2.73INMNGEE479 pKa = 4.45TIFQGTGNDD488 pKa = 3.45VEE490 pKa = 5.56FIYY493 pKa = 11.05QNVQKK498 pKa = 10.44NHH500 pKa = 6.27EE501 pKa = 4.6GNTLKK506 pKa = 10.74QPFFKK511 pKa = 10.29IKK513 pKa = 10.15EE514 pKa = 4.03QTPP517 pKa = 3.36
TT1 pKa = 5.8YY2 pKa = 9.72TPDD5 pKa = 3.56PGFVGEE11 pKa = 6.19DD12 pKa = 3.66VFCYY16 pKa = 10.08AASDD20 pKa = 4.98GIASDD25 pKa = 3.96TACVAVTVQPNPTPANDD42 pKa = 3.85SPLALNDD49 pKa = 3.37NTQTTEE55 pKa = 3.98GTPLSVNVLANDD67 pKa = 3.42VDD69 pKa = 4.18PDD71 pKa = 3.69GDD73 pKa = 3.77ALQNPTVVQAPANGTASVNADD94 pKa = 3.01GTILYY99 pKa = 8.88TPDD102 pKa = 3.54PGFVGTDD109 pKa = 2.9TLTYY113 pKa = 9.67RR114 pKa = 11.84VCDD117 pKa = 3.17TGTPSLCDD125 pKa = 3.24SAQVIVQVLPAPVDD139 pKa = 3.44PAANQAPIAVDD150 pKa = 3.54DD151 pKa = 4.95ANTTTVNTPVTGTVAANDD169 pKa = 3.84SDD171 pKa = 4.5PDD173 pKa = 3.7GDD175 pKa = 4.13ALTFAGLTNPANGTLTVNADD195 pKa = 2.93GSYY198 pKa = 10.79VYY200 pKa = 10.35TPAADD205 pKa = 4.85FIGSDD210 pKa = 3.14VFTYY214 pKa = 7.31TVCDD218 pKa = 3.23NGTPSLCDD226 pKa = 3.0TATVFITVTPVAGKK240 pKa = 10.03VALLPKK246 pKa = 10.28VYY248 pKa = 10.51LQGALFGVFLPDD260 pKa = 2.78TLMRR264 pKa = 11.84DD265 pKa = 3.78DD266 pKa = 5.76LRR268 pKa = 11.84LKK270 pKa = 10.81NLIPTTSPYY279 pKa = 10.69PDD281 pKa = 3.49MGLIGITSANVANITVVNASTTSTNNSIVDD311 pKa = 3.44WVFVEE316 pKa = 4.76LRR318 pKa = 11.84SALDD322 pKa = 3.24STLVLDD328 pKa = 3.99SRR330 pKa = 11.84SALVQRR336 pKa = 11.84DD337 pKa = 3.31GDD339 pKa = 3.84IVEE342 pKa = 4.22VDD344 pKa = 3.63GLSAITFDD352 pKa = 3.68SAVPGSYY359 pKa = 9.94YY360 pKa = 10.53VVVRR364 pKa = 11.84HH365 pKa = 6.09RR366 pKa = 11.84NHH368 pKa = 6.71LGVMSASPIALSTATTVVDD387 pKa = 4.06FRR389 pKa = 11.84KK390 pKa = 10.07AATPTFNLNAASAVNIPQVPVQQGVALWAGNALYY424 pKa = 10.92LNTLDD429 pKa = 4.59SMRR432 pKa = 11.84EE433 pKa = 4.07VIFQGPDD440 pKa = 2.65NDD442 pKa = 3.73VNVIYY447 pKa = 10.24QQVINSPANALFKK460 pKa = 11.29SPFFNLKK467 pKa = 9.89GYY469 pKa = 10.86YY470 pKa = 10.22NGDD473 pKa = 2.73INMNGEE479 pKa = 4.45TIFQGTGNDD488 pKa = 3.45VEE490 pKa = 5.56FIYY493 pKa = 11.05QNVQKK498 pKa = 10.44NHH500 pKa = 6.27EE501 pKa = 4.6GNTLKK506 pKa = 10.74QPFFKK511 pKa = 10.29IKK513 pKa = 10.15EE514 pKa = 4.03QTPP517 pKa = 3.36
Molecular weight: 54.4 kDa
Isoelectric point according different methods:
Protein with the highest isoelectric point:
>tr|A0A4R4KG47|A0A4R4KG47_9BACT Efflux RND transporter periplasmic adaptor subunit OS=Arundinibacter roseus OX=2070510 GN=EZE20_08595 PE=3 SV=1
MM1 pKa = 7.61SNLKK5 pKa = 10.65NYY7 pKa = 8.47FQLGDD12 pKa = 3.52VFSYY16 pKa = 8.96FIRR19 pKa = 11.84VFKK22 pKa = 10.73KK23 pKa = 10.28PSSDD27 pKa = 3.39APNSFSLRR35 pKa = 11.84MMHH38 pKa = 7.15GINRR42 pKa = 11.84ISIVMFLFCVVVMIIRR58 pKa = 11.84AIMRR62 pKa = 3.93
MM1 pKa = 7.61SNLKK5 pKa = 10.65NYY7 pKa = 8.47FQLGDD12 pKa = 3.52VFSYY16 pKa = 8.96FIRR19 pKa = 11.84VFKK22 pKa = 10.73KK23 pKa = 10.28PSSDD27 pKa = 3.39APNSFSLRR35 pKa = 11.84MMHH38 pKa = 7.15GINRR42 pKa = 11.84ISIVMFLFCVVVMIIRR58 pKa = 11.84AIMRR62 pKa = 3.93
Molecular weight: 7.28 kDa
Isoelectric point according different methods:
Peptides (in silico digests for buttom-up proteomics)
Below you can find in silico digests of the whole proteome with Trypsin, Chymotrypsin, Trypsin+LysC, LysN, ArgC proteases suitable for different mass spec machines.| Try ESI |
 |
|---|
| ChTry ESI |
|
|---|
| ArgC ESI |
|
|---|
| LysN ESI |
|
|---|
| TryLysC ESI |
|
|---|
| Try MALDI |
|
|---|
| ChTry MALDI |
|
|---|
| ArgC MALDI |
|
|---|
| LysN MALDI |
|
|---|
| TryLysC MALDI |
|
|---|
| Try LTQ |
|
|---|
| ChTry LTQ |
|
|---|
| ArgC LTQ |
|
|---|
| LysN LTQ |
|
|---|
| TryLysC LTQ |
|
|---|
| Try MSlow |
|
|---|
| ChTry MSlow |
|
|---|
| ArgC MSlow |
|
|---|
| LysN MSlow |
|
|---|
| TryLysC MSlow |
|
|---|
| Try MShigh |
|
|---|
| ChTry MShigh |
|
|---|
| ArgC MShigh |
|
|---|
| LysN MShigh |
|
|---|
| TryLysC MShigh |
|
|---|
General Statistics
Number of major isoforms |
Number of additional isoforms |
Number of all proteins |
Number of amino acids |
Min. Seq. Length |
Max. Seq. Length |
Avg. Seq. Length |
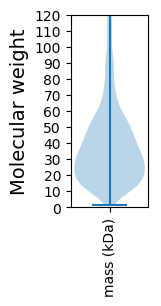
Avg. Mol. Weight |
|---|---|---|---|---|---|---|---|
0 |
1707330 |
13 |
3951 |
364.9 |
40.87 |
Amino acid frequency
Ala |
Cys |
Asp |
Glu |
Phe |
Gly |
His |
Ile |
Lys |
Leu |
|---|---|---|---|---|---|---|---|---|---|
7.645 ± 0.038 | 0.81 ± 0.013 |
5.164 ± 0.028 | 6.09 ± 0.04 |
4.898 ± 0.027 | 7.054 ± 0.041 |
1.88 ± 0.02 | 6.255 ± 0.029 |
5.675 ± 0.036 | 10.031 ± 0.04 |
Met |
Asn |
Gln |
Pro |
Arg |
Ser |
Thr |
Val |
Trp |
Tyr |
|---|---|---|---|---|---|---|---|---|---|
2.274 ± 0.016 | 4.768 ± 0.035 |
4.38 ± 0.026 | 4.155 ± 0.024 |
4.813 ± 0.033 | 6.427 ± 0.033 |
6.031 ± 0.042 | 6.501 ± 0.028 |
1.346 ± 0.014 | 3.802 ± 0.023 |
Most of the basic statistics you can see at this page can be downloaded from this CSV file
See this proteome in:

Proteome-pI is available under Creative Commons Attribution-NoDerivs license, for more details see here
| Reference: Kozlowski LP. Proteome-pI 2.0: Proteome Isoelectric Point Database Update. Nucleic Acids Res. 2021, doi: 10.1093/nar/gkab944 | Contact: Lukasz P. Kozlowski |