Sphingobium sp. MI1205
Taxonomy: cellular organisms; Bacteria; Proteobacteria; Alphaproteobacteria; Sphingomonadales; Sphingomonadaceae; Sphingobium; unclassified Sphingobium
Average proteome isoelectric point is 6.6
Get precalculated fractions of proteins
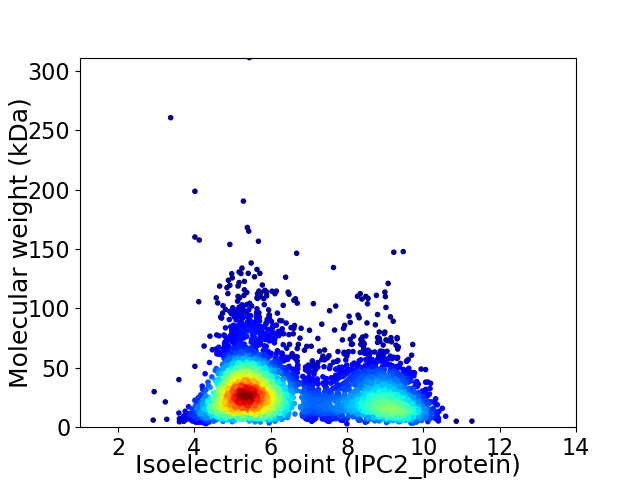
Virtual 2D-PAGE plot for 4473 proteins (isoelectric point calculated using IPC2_protein)
Get csv file with sequences according to given criteria:
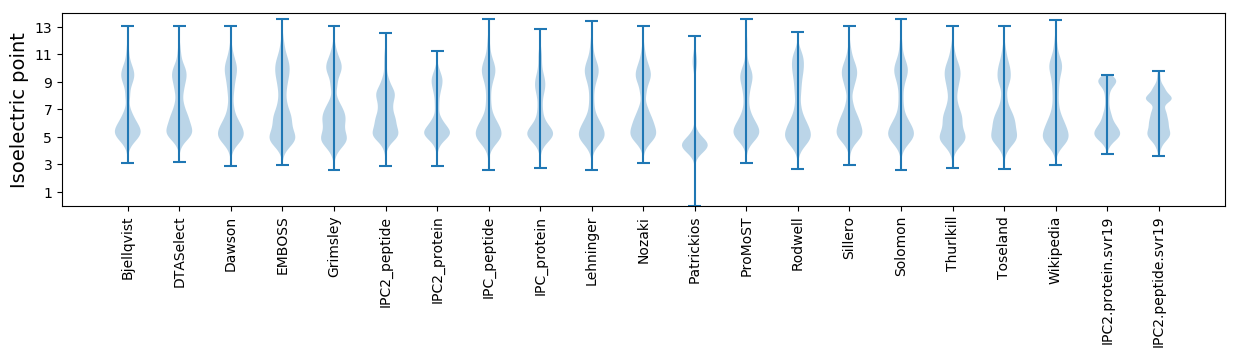
* You can choose from 21 different methods for calculating isoelectric point
Summary statistics related to proteome-wise predictions
Protein with the lowest isoelectric point:
>tr|A0A126RCP7|A0A126RCP7_9SPHN Uncharacterized protein OS=Sphingobium sp. MI1205 OX=407020 GN=K663_16826 PE=4 SV=1
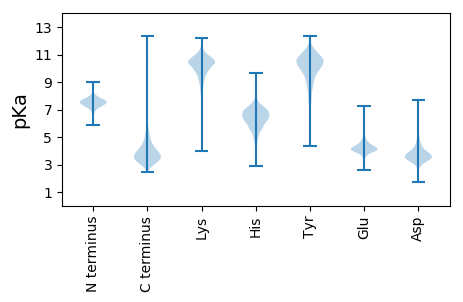
MM1 pKa = 7.86AKK3 pKa = 8.9LTVVNRR9 pKa = 11.84SGEE12 pKa = 4.16EE13 pKa = 3.79QTIEE17 pKa = 4.08AQDD20 pKa = 3.77GLSVMEE26 pKa = 4.63LLRR29 pKa = 11.84DD30 pKa = 3.58NGFDD34 pKa = 4.18EE35 pKa = 5.85LLALCGGCCSCATCHH50 pKa = 6.46VYY52 pKa = 10.57VDD54 pKa = 3.91PSFADD59 pKa = 3.54SLPTISDD66 pKa = 4.05DD67 pKa = 4.87EE68 pKa = 5.05NDD70 pKa = 4.32LLDD73 pKa = 4.7SSDD76 pKa = 3.35HH77 pKa = 6.39RR78 pKa = 11.84NEE80 pKa = 3.84HH81 pKa = 6.42SRR83 pKa = 11.84LSCQLPFSDD92 pKa = 4.79SLDD95 pKa = 3.54GLRR98 pKa = 11.84VTIAPEE104 pKa = 3.78DD105 pKa = 3.45
MM1 pKa = 7.86AKK3 pKa = 8.9LTVVNRR9 pKa = 11.84SGEE12 pKa = 4.16EE13 pKa = 3.79QTIEE17 pKa = 4.08AQDD20 pKa = 3.77GLSVMEE26 pKa = 4.63LLRR29 pKa = 11.84DD30 pKa = 3.58NGFDD34 pKa = 4.18EE35 pKa = 5.85LLALCGGCCSCATCHH50 pKa = 6.46VYY52 pKa = 10.57VDD54 pKa = 3.91PSFADD59 pKa = 3.54SLPTISDD66 pKa = 4.05DD67 pKa = 4.87EE68 pKa = 5.05NDD70 pKa = 4.32LLDD73 pKa = 4.7SSDD76 pKa = 3.35HH77 pKa = 6.39RR78 pKa = 11.84NEE80 pKa = 3.84HH81 pKa = 6.42SRR83 pKa = 11.84LSCQLPFSDD92 pKa = 4.79SLDD95 pKa = 3.54GLRR98 pKa = 11.84VTIAPEE104 pKa = 3.78DD105 pKa = 3.45
Molecular weight: 11.42 kDa
Isoelectric point according different methods:
Protein with the highest isoelectric point:
>tr|A0A126R433|A0A126R433_9SPHN Chromate transport protein ChrA OS=Sphingobium sp. MI1205 OX=407020 GN=K663_03260 PE=3 SV=1
MM1 pKa = 7.45KK2 pKa = 9.61RR3 pKa = 11.84TFQPSNLVRR12 pKa = 11.84KK13 pKa = 9.18RR14 pKa = 11.84RR15 pKa = 11.84HH16 pKa = 4.42GFRR19 pKa = 11.84ARR21 pKa = 11.84MATPGGRR28 pKa = 11.84NVLRR32 pKa = 11.84ARR34 pKa = 11.84RR35 pKa = 11.84ARR37 pKa = 11.84GRR39 pKa = 11.84KK40 pKa = 9.07SLSAA44 pKa = 3.93
MM1 pKa = 7.45KK2 pKa = 9.61RR3 pKa = 11.84TFQPSNLVRR12 pKa = 11.84KK13 pKa = 9.18RR14 pKa = 11.84RR15 pKa = 11.84HH16 pKa = 4.42GFRR19 pKa = 11.84ARR21 pKa = 11.84MATPGGRR28 pKa = 11.84NVLRR32 pKa = 11.84ARR34 pKa = 11.84RR35 pKa = 11.84ARR37 pKa = 11.84GRR39 pKa = 11.84KK40 pKa = 9.07SLSAA44 pKa = 3.93
Molecular weight: 5.11 kDa
Isoelectric point according different methods:
Peptides (in silico digests for buttom-up proteomics)
Below you can find in silico digests of the whole proteome with Trypsin, Chymotrypsin, Trypsin+LysC, LysN, ArgC proteases suitable for different mass spec machines.| Try ESI |
 |
|---|
| ChTry ESI |
|
|---|
| ArgC ESI |
|
|---|
| LysN ESI |
|
|---|
| TryLysC ESI |
|
|---|
| Try MALDI |
|
|---|
| ChTry MALDI |
|
|---|
| ArgC MALDI |
|
|---|
| LysN MALDI |
|
|---|
| TryLysC MALDI |
|
|---|
| Try LTQ |
|
|---|
| ChTry LTQ |
|
|---|
| ArgC LTQ |
|
|---|
| LysN LTQ |
|
|---|
| TryLysC LTQ |
|
|---|
| Try MSlow |
|
|---|
| ChTry MSlow |
|
|---|
| ArgC MSlow |
|
|---|
| LysN MSlow |
|
|---|
| TryLysC MSlow |
|
|---|
| Try MShigh |
|
|---|
| ChTry MShigh |
|
|---|
| ArgC MShigh |
|
|---|
| LysN MShigh |
|
|---|
| TryLysC MShigh |
|
|---|
General Statistics
Number of major isoforms |
Number of additional isoforms |
Number of all proteins |
Number of amino acids |
Min. Seq. Length |
Max. Seq. Length |
Avg. Seq. Length |
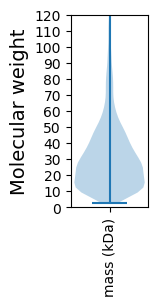
Avg. Mol. Weight |
|---|---|---|---|---|---|---|---|
0 |
1347481 |
26 |
2803 |
301.2 |
32.69 |
Amino acid frequency
Ala |
Cys |
Asp |
Glu |
Phe |
Gly |
His |
Ile |
Lys |
Leu |
|---|---|---|---|---|---|---|---|---|---|
12.816 ± 0.059 | 0.834 ± 0.012 |
6.004 ± 0.029 | 5.499 ± 0.03 |
3.514 ± 0.023 | 8.643 ± 0.043 |
2.072 ± 0.018 | 5.229 ± 0.023 |
3.084 ± 0.029 | 9.968 ± 0.04 |
Met |
Asn |
Gln |
Pro |
Arg |
Ser |
Thr |
Val |
Trp |
Tyr |
|---|---|---|---|---|---|---|---|---|---|
2.579 ± 0.019 | 2.589 ± 0.023 |
5.202 ± 0.028 | 3.299 ± 0.02 |
7.462 ± 0.04 | 5.505 ± 0.029 |
5.066 ± 0.03 | 6.996 ± 0.026 |
1.416 ± 0.018 | 2.224 ± 0.019 |
Most of the basic statistics you can see at this page can be downloaded from this CSV file
See this proteome in:

Proteome-pI is available under Creative Commons Attribution-NoDerivs license, for more details see here
| Reference: Kozlowski LP. Proteome-pI 2.0: Proteome Isoelectric Point Database Update. Nucleic Acids Res. 2021, doi: 10.1093/nar/gkab944 | Contact: Lukasz P. Kozlowski |