Rubellimicrobium roseum
Taxonomy: cellular organisms; Bacteria; Proteobacteria; Alphaproteobacteria; Rhodobacterales; Roseobacteraceae; Rubellimicrobium
Average proteome isoelectric point is 6.36
Get precalculated fractions of proteins
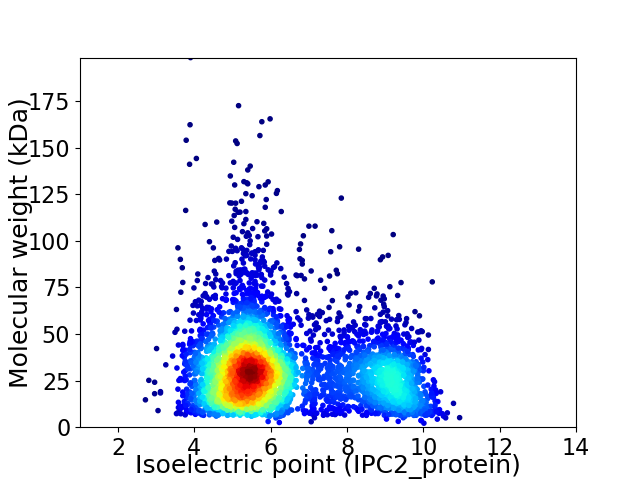
Virtual 2D-PAGE plot for 4478 proteins (isoelectric point calculated using IPC2_protein)
Get csv file with sequences according to given criteria:
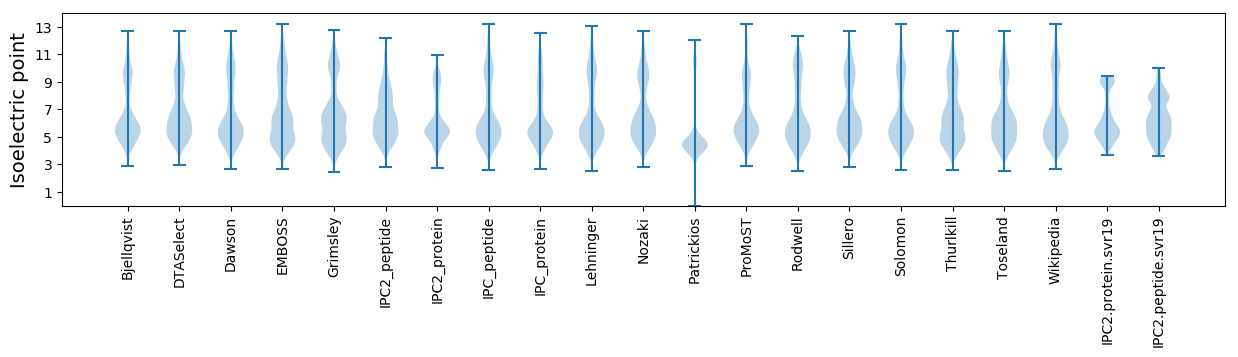
* You can choose from 21 different methods for calculating isoelectric point
Summary statistics related to proteome-wise predictions
Protein with the lowest isoelectric point:
>tr|A0A5C4N8N6|A0A5C4N8N6_9RHOB Uncharacterized protein OS=Rubellimicrobium roseum OX=687525 GN=FHG71_20985 PE=4 SV=1
MM1 pKa = 7.51KK2 pKa = 10.03IVSAALAAVTLSVGLGVPAFAQDD25 pKa = 3.11KK26 pKa = 8.39GTIGIAMPTQSSARR40 pKa = 11.84WIADD44 pKa = 3.1GNNMVEE50 pKa = 4.14QFEE53 pKa = 4.27AAGYY57 pKa = 7.79DD58 pKa = 3.41TVLQYY63 pKa = 11.43AEE65 pKa = 5.34DD66 pKa = 5.69DD67 pKa = 3.67IPTQLSQVEE76 pKa = 4.09NMISQGVDD84 pKa = 2.86ALVIAAIDD92 pKa = 3.8GTTLSSALEE101 pKa = 3.91NAEE104 pKa = 3.82AAGIPVIAYY113 pKa = 8.43DD114 pKa = 4.1RR115 pKa = 11.84LIRR118 pKa = 11.84DD119 pKa = 3.51SGAVDD124 pKa = 3.82YY125 pKa = 11.17YY126 pKa = 11.27ATFDD130 pKa = 3.55NFQVGVQQAEE140 pKa = 4.26TLVACLNEE148 pKa = 4.06RR149 pKa = 11.84FADD152 pKa = 3.6QKK154 pKa = 9.83PWNVEE159 pKa = 3.9LFGGSPDD166 pKa = 3.91DD167 pKa = 3.85NNAFFFYY174 pKa = 10.43DD175 pKa = 3.25GAMSILQPMIDD186 pKa = 3.71AGDD189 pKa = 3.44IVVPSGQMGMDD200 pKa = 3.28VVGTLRR206 pKa = 11.84WDD208 pKa = 3.46PATAQSRR215 pKa = 11.84MDD217 pKa = 3.71NLLSANYY224 pKa = 10.63GDD226 pKa = 4.17TTLHH230 pKa = 6.52GALSPYY236 pKa = 10.37DD237 pKa = 3.66GLSIGILSSVKK248 pKa = 10.05GVGYY252 pKa = 10.71GSGDD256 pKa = 3.11MAMPCVTGQDD266 pKa = 3.4AEE268 pKa = 4.56VPSVKK273 pKa = 10.25SIQAGEE279 pKa = 4.08QYY281 pKa = 9.89STIFKK286 pKa = 8.73DD287 pKa = 3.35TRR289 pKa = 11.84EE290 pKa = 4.05LARR293 pKa = 11.84VTVGMVDD300 pKa = 3.06AVLAGGEE307 pKa = 4.06PEE309 pKa = 4.45INDD312 pKa = 3.58TEE314 pKa = 4.58TYY316 pKa = 10.57DD317 pKa = 3.49NGVKK321 pKa = 9.97VVPSYY326 pKa = 11.47LLAPVPVDD334 pKa = 2.91ATNYY338 pKa = 10.25EE339 pKa = 4.17EE340 pKa = 4.24TLVGSGYY347 pKa = 8.69YY348 pKa = 8.82TAEE351 pKa = 4.36DD352 pKa = 3.7LQQ354 pKa = 5.08
MM1 pKa = 7.51KK2 pKa = 10.03IVSAALAAVTLSVGLGVPAFAQDD25 pKa = 3.11KK26 pKa = 8.39GTIGIAMPTQSSARR40 pKa = 11.84WIADD44 pKa = 3.1GNNMVEE50 pKa = 4.14QFEE53 pKa = 4.27AAGYY57 pKa = 7.79DD58 pKa = 3.41TVLQYY63 pKa = 11.43AEE65 pKa = 5.34DD66 pKa = 5.69DD67 pKa = 3.67IPTQLSQVEE76 pKa = 4.09NMISQGVDD84 pKa = 2.86ALVIAAIDD92 pKa = 3.8GTTLSSALEE101 pKa = 3.91NAEE104 pKa = 3.82AAGIPVIAYY113 pKa = 8.43DD114 pKa = 4.1RR115 pKa = 11.84LIRR118 pKa = 11.84DD119 pKa = 3.51SGAVDD124 pKa = 3.82YY125 pKa = 11.17YY126 pKa = 11.27ATFDD130 pKa = 3.55NFQVGVQQAEE140 pKa = 4.26TLVACLNEE148 pKa = 4.06RR149 pKa = 11.84FADD152 pKa = 3.6QKK154 pKa = 9.83PWNVEE159 pKa = 3.9LFGGSPDD166 pKa = 3.91DD167 pKa = 3.85NNAFFFYY174 pKa = 10.43DD175 pKa = 3.25GAMSILQPMIDD186 pKa = 3.71AGDD189 pKa = 3.44IVVPSGQMGMDD200 pKa = 3.28VVGTLRR206 pKa = 11.84WDD208 pKa = 3.46PATAQSRR215 pKa = 11.84MDD217 pKa = 3.71NLLSANYY224 pKa = 10.63GDD226 pKa = 4.17TTLHH230 pKa = 6.52GALSPYY236 pKa = 10.37DD237 pKa = 3.66GLSIGILSSVKK248 pKa = 10.05GVGYY252 pKa = 10.71GSGDD256 pKa = 3.11MAMPCVTGQDD266 pKa = 3.4AEE268 pKa = 4.56VPSVKK273 pKa = 10.25SIQAGEE279 pKa = 4.08QYY281 pKa = 9.89STIFKK286 pKa = 8.73DD287 pKa = 3.35TRR289 pKa = 11.84EE290 pKa = 4.05LARR293 pKa = 11.84VTVGMVDD300 pKa = 3.06AVLAGGEE307 pKa = 4.06PEE309 pKa = 4.45INDD312 pKa = 3.58TEE314 pKa = 4.58TYY316 pKa = 10.57DD317 pKa = 3.49NGVKK321 pKa = 9.97VVPSYY326 pKa = 11.47LLAPVPVDD334 pKa = 2.91ATNYY338 pKa = 10.25EE339 pKa = 4.17EE340 pKa = 4.24TLVGSGYY347 pKa = 8.69YY348 pKa = 8.82TAEE351 pKa = 4.36DD352 pKa = 3.7LQQ354 pKa = 5.08
Molecular weight: 37.43 kDa
Isoelectric point according different methods:
Protein with the highest isoelectric point:
>tr|A0A5C4N835|A0A5C4N835_9RHOB FixH family protein OS=Rubellimicrobium roseum OX=687525 GN=FHG71_18405 PE=4 SV=1
MM1 pKa = 7.45KK2 pKa = 9.61RR3 pKa = 11.84TFQPSNRR10 pKa = 11.84VRR12 pKa = 11.84KK13 pKa = 9.2ARR15 pKa = 11.84HH16 pKa = 4.71GFRR19 pKa = 11.84ARR21 pKa = 11.84MATKK25 pKa = 10.36GGRR28 pKa = 11.84AVLNRR33 pKa = 11.84RR34 pKa = 11.84RR35 pKa = 11.84ARR37 pKa = 11.84GRR39 pKa = 11.84KK40 pKa = 8.41VLCAA44 pKa = 3.88
MM1 pKa = 7.45KK2 pKa = 9.61RR3 pKa = 11.84TFQPSNRR10 pKa = 11.84VRR12 pKa = 11.84KK13 pKa = 9.2ARR15 pKa = 11.84HH16 pKa = 4.71GFRR19 pKa = 11.84ARR21 pKa = 11.84MATKK25 pKa = 10.36GGRR28 pKa = 11.84AVLNRR33 pKa = 11.84RR34 pKa = 11.84RR35 pKa = 11.84ARR37 pKa = 11.84GRR39 pKa = 11.84KK40 pKa = 8.41VLCAA44 pKa = 3.88
Molecular weight: 5.12 kDa
Isoelectric point according different methods:
Peptides (in silico digests for buttom-up proteomics)
Below you can find in silico digests of the whole proteome with Trypsin, Chymotrypsin, Trypsin+LysC, LysN, ArgC proteases suitable for different mass spec machines.| Try ESI |
 |
|---|
| ChTry ESI |
|
|---|
| ArgC ESI |
|
|---|
| LysN ESI |
|
|---|
| TryLysC ESI |
|
|---|
| Try MALDI |
|
|---|
| ChTry MALDI |
|
|---|
| ArgC MALDI |
|
|---|
| LysN MALDI |
|
|---|
| TryLysC MALDI |
|
|---|
| Try LTQ |
|
|---|
| ChTry LTQ |
|
|---|
| ArgC LTQ |
|
|---|
| LysN LTQ |
|
|---|
| TryLysC LTQ |
|
|---|
| Try MSlow |
|
|---|
| ChTry MSlow |
|
|---|
| ArgC MSlow |
|
|---|
| LysN MSlow |
|
|---|
| TryLysC MSlow |
|
|---|
| Try MShigh |
|
|---|
| ChTry MShigh |
|
|---|
| ArgC MShigh |
|
|---|
| LysN MShigh |
|
|---|
| TryLysC MShigh |
|
|---|
General Statistics
Number of major isoforms |
Number of additional isoforms |
Number of all proteins |
Number of amino acids |
Min. Seq. Length |
Max. Seq. Length |
Avg. Seq. Length |
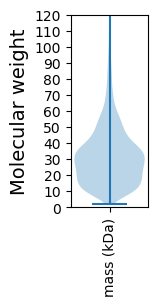
Avg. Mol. Weight |
|---|---|---|---|---|---|---|---|
0 |
1378203 |
21 |
1941 |
307.8 |
33.23 |
Amino acid frequency
Ala |
Cys |
Asp |
Glu |
Phe |
Gly |
His |
Ile |
Lys |
Leu |
|---|---|---|---|---|---|---|---|---|---|
13.291 ± 0.053 | 0.787 ± 0.011 |
5.756 ± 0.036 | 6.104 ± 0.031 |
3.37 ± 0.022 | 9.271 ± 0.045 |
2.033 ± 0.018 | 4.24 ± 0.026 |
2.05 ± 0.028 | 10.854 ± 0.054 |
Met |
Asn |
Gln |
Pro |
Arg |
Ser |
Thr |
Val |
Trp |
Tyr |
|---|---|---|---|---|---|---|---|---|---|
2.384 ± 0.018 | 2.086 ± 0.022 |
5.738 ± 0.031 | 2.98 ± 0.019 |
8.042 ± 0.043 | 4.702 ± 0.023 |
5.207 ± 0.023 | 7.652 ± 0.034 |
1.537 ± 0.014 | 1.918 ± 0.018 |
Most of the basic statistics you can see at this page can be downloaded from this CSV file
See this proteome in:

Proteome-pI is available under Creative Commons Attribution-NoDerivs license, for more details see here
| Reference: Kozlowski LP. Proteome-pI 2.0: Proteome Isoelectric Point Database Update. Nucleic Acids Res. 2021, doi: 10.1093/nar/gkab944 | Contact: Lukasz P. Kozlowski |